
|
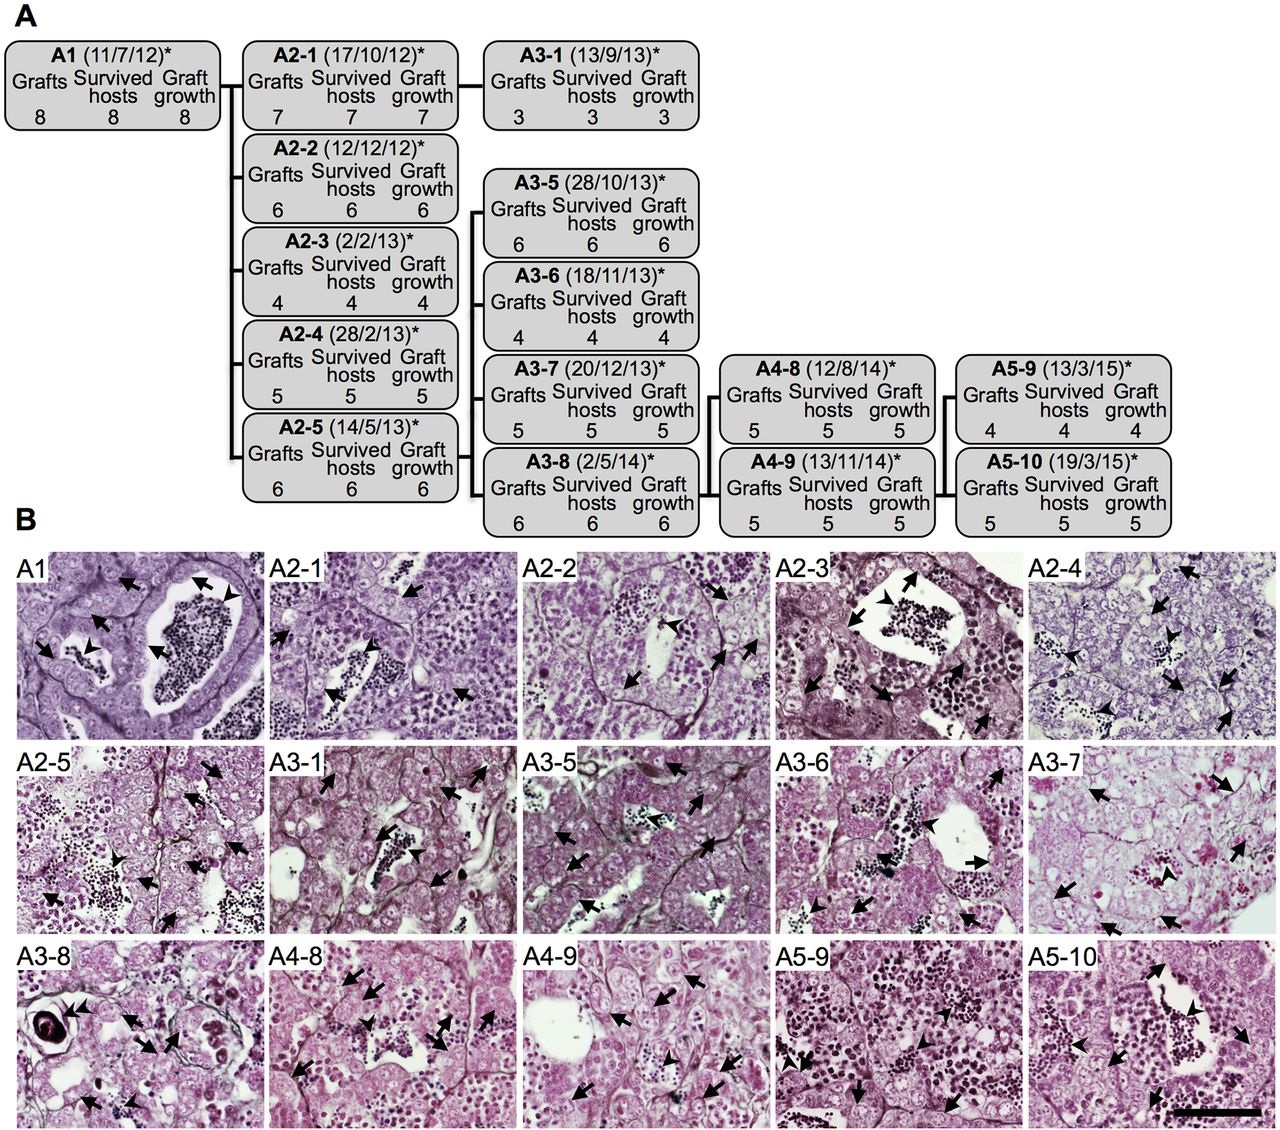
Fig. 2
Serial transplantation of the testicular hyperplasia A. (A) Each box shows the number of the grafted fragments, the number of recipients surviving for more than 1month, and the number of the grown graft in each transplantation steps. The number in parentheses indicates day/month/year of the transplantation. (B) Histological observation of a grafted hyperplasia. Sections of each testis correspond to the grafts described in A. Many single spermatogonia (arrows) were observed in grafts and sperm (arrowhead) were present. Testis-ova (the presence of oocytes in testis) were observed in A3-8 (fish no. 8 of the third serial transplantation of hyperplasia A; double arrowheads). Scale bar: 50µm. Serial transplantation of other testicular hyperplasia lines are shown in Fig. S2.