
Fig. 1
- ID
- ZDB-IMAGE-160321-12
- Genes
- Publication
- Eom et al., 2015 - Long-distance communication by specialized cellular projections during pigment pattern development and evolution
- All Figures
- Figures for Eom et al., 2015
|
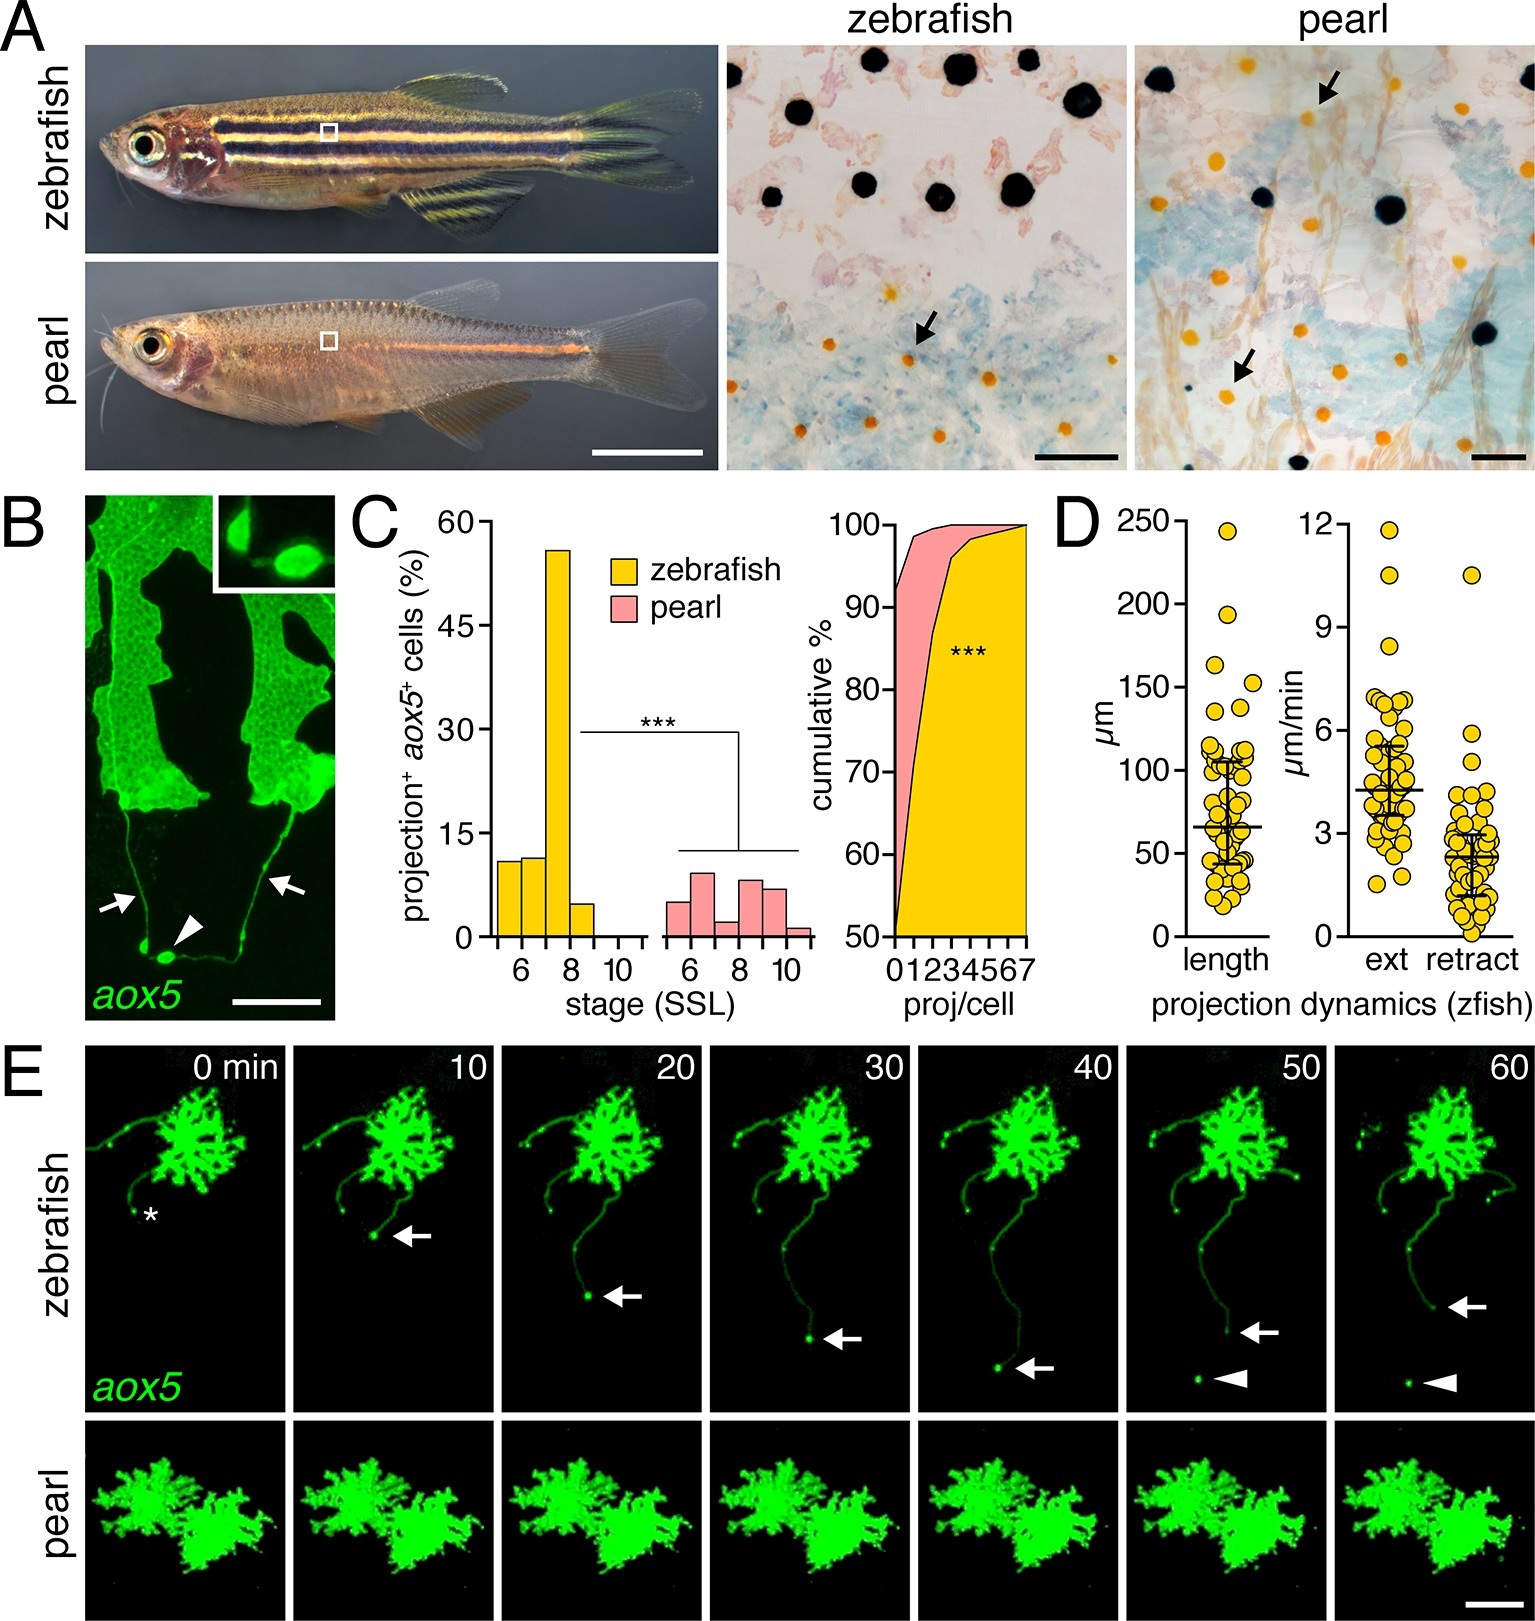
Fig. 1
Pigment cell projections. (A) Zebrafish and pearl danio. Right, melanophores and xanthophores (arrows) after epinephrine treatment to contract pigment granules. (B) Long projections by zebrafish aox5+ cells of xanthophore lineage (arrows) with membraneous vesicles (arrowhead, inset). (C) Zebrafish aox5+ cells were more likely to extend projections than pearl, especially during early stripe development [7–8 SSL (Parichy et al., 2009); species x stage, χ2=103.4, d.f.=4, p<0.0001; N=929, 1259 cells for zebrafish and pearl; projections per cell: χ2=45.3, d.f.=1, p<0.0001]. (D) In zebrafish, projections were often long and fast. Bars indicate median ± interquartile range (IQR). (E) Extension and retraction (arrow) and release of vesicle (arrowhead) in zebrafish but not pearl. Scale bars: 5 mm (A, left); 50 µm (A, right); 10 µm (B); 50 µm (E).