
Fig. 5
- ID
- ZDB-IMAGE-160317-7
- Publication
- Lisse et al., 2016 - Comparative transcriptomic profiling of hydrogen peroxide signaling networks in zebrafish and human keratinocytes: Implications toward conservation, migration and wound healing
- All Figures
- Figures for Lisse et al., 2016
|
Fig. 5
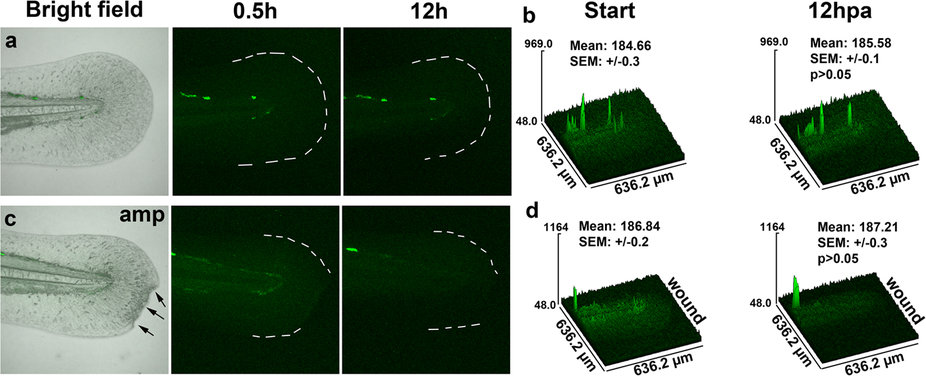
Comparison of ARE/EPRE:GFP activation in zebrafish.
(a) The caudal fin of an uninjured EPRE:GFP larval zebrafish was imaged over the course of 12 hours. First and last images of the time-lapse sequence are shown. (b) Matching surface plots and quantification, comparing the fluorescence means of 4 individual fish (n = 4). Statistical significance was tested between first and last time points, showing lack of EPRE:GFP activation by 12 hours. (c) First and last image of a time-lapse sequence showing the amputated caudal fin (arrows) of an EPRE:GFP larval zebrafish. (d) Matching surface plots and quantification, comparing the fluorescence means of 6 individual fish, show that injury fails to activate EPRE:GFP.