
|
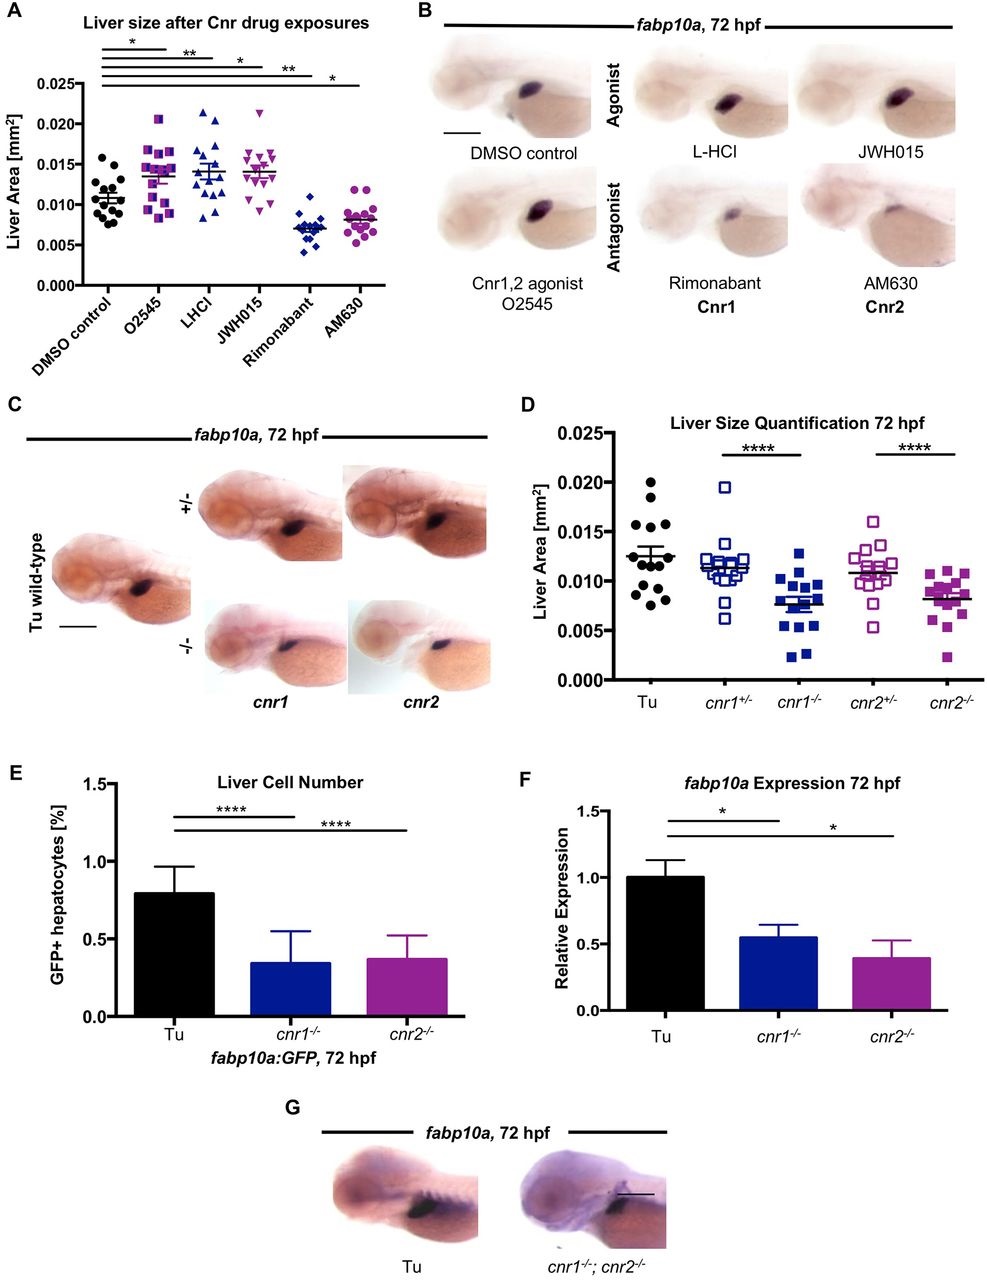
Fig. 1
Chemical and genetic modulation of endocannabinoid (EC) signaling alters liver size and cell number during zebrafish development. (A) Quantification of liver size in DMSO-treated and Cnr agonist/antagonist-treated WT embryos from 18-72hpf. Agonists (O2545, L-HCl, JWH015) increased, whereas antagonists (rimonabant, AM630) decreased, liver size. **P<0.01, DMSO versus L-HCl or rimonabant; *P<0.05, DMSO versus O2545, JWH015 or AM630. (B) Representative ISH images for fabp10a in zebrafish embryos after treatment with cannabinoid drugs from 18-72hpf. (C) Representative ISH images showing decreased fabp10a expression in cnr1-/- and cnr2-/- mutants compared with WT and heterozygous siblings. (D) Quantification of liver size by measurement of fabp10a expression area after ISH in WT (Tu), heterozygous, and homozygous cnr1-/- and cnr2-/- mutants at 72hpf. Results represent one independent experiment of triplicate experiments yielding similar results. ****P<0.0001, for cnr1+/- versus cnr1-/- and for cnr2+/- versus cnr2-/-. (E) FACS quantification of fabp10a:GFP hepatocyte number in WT compared with cnr1-/- and cnr2-/- mutants at 72hpf. The fraction of GFP+ cells was normalized to controls. n=3 pooled samples of ten embryos. ****P<0.0001, fabp10a:GFP versus cnr1-/- and cnr2-/-. (F) Quantification of fabp10a expression in WT and Cnr mutants by qRT-PCR at 72hpf. n=3 pooled samples of 20 embryos. *P<0.05. (G) ISH for fabp10a in cnr1-/-; cnr2-/- double mutants at 72hpf. All error bars show mean±s.e.m. P-values by one-way ANOVA. Scale bars: 0.2mm.