
Fig. 5
- ID
- ZDB-IMAGE-160316-5
- Publication
- He et al., 2016 - Histone deacetylase 1 is required for the development of the zebrafish inner ear
- All Figures
- Figures for He et al., 2016
|
Fig. 5
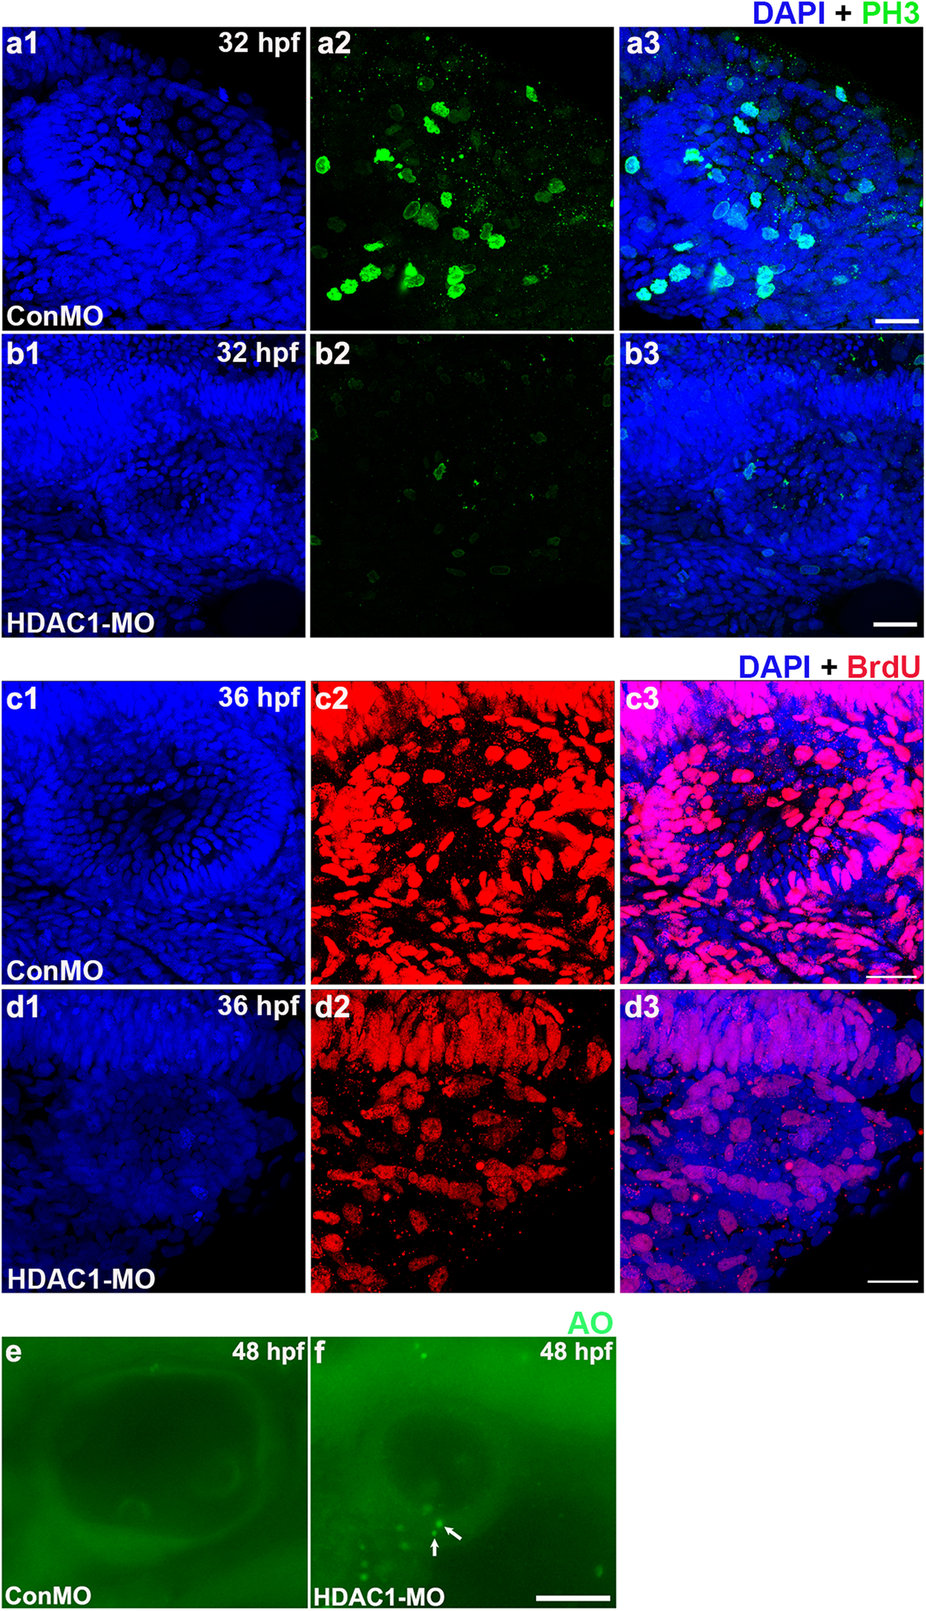
Analysis of cell proliferation and death in the otic vesicle of HDAC1 morphants.
(a,b) Mitotic cells in the 32 hpf otic vesicle of a control embryo (a) and an HDAC1 morphant (b) were identified by phospho-histone H3 expression, a mitotic marker. (c,d) Dividing cells in the otic vesicle of a control embryo (c) and an HDAC1 morphant (d) at 36 hpf were identified by BrdU staining. HDAC1 morphants often contained decreased numbers of proliferating cells within the sensory epithelia. (e,f) AO labeling of dying cells in the otic vesicle of a control embryo (e) and an HDAC1 morphant (f) at 48 hpf. White arrows indicate AO-positive cells. HDAC1 morphants often contained multiple dying cells within the sensory epithelia. All images show lateral views with the anterior to the left and the dorsal side up. Scale bars, 20 µm (a-d), Scale bars, 50 µm (e,f).