
Fig. S8
- ID
- ZDB-IMAGE-160316-44
- Publication
- Xu et al., 2016 - Four and a Half LIM Domains 1b (Fhl1b) Is Essential for Regulating the Liver versus Pancreas Fate Decision and for β-Cell Regeneration
- All Figures
- Figures for Xu et al., 2016
|
Fig. S8
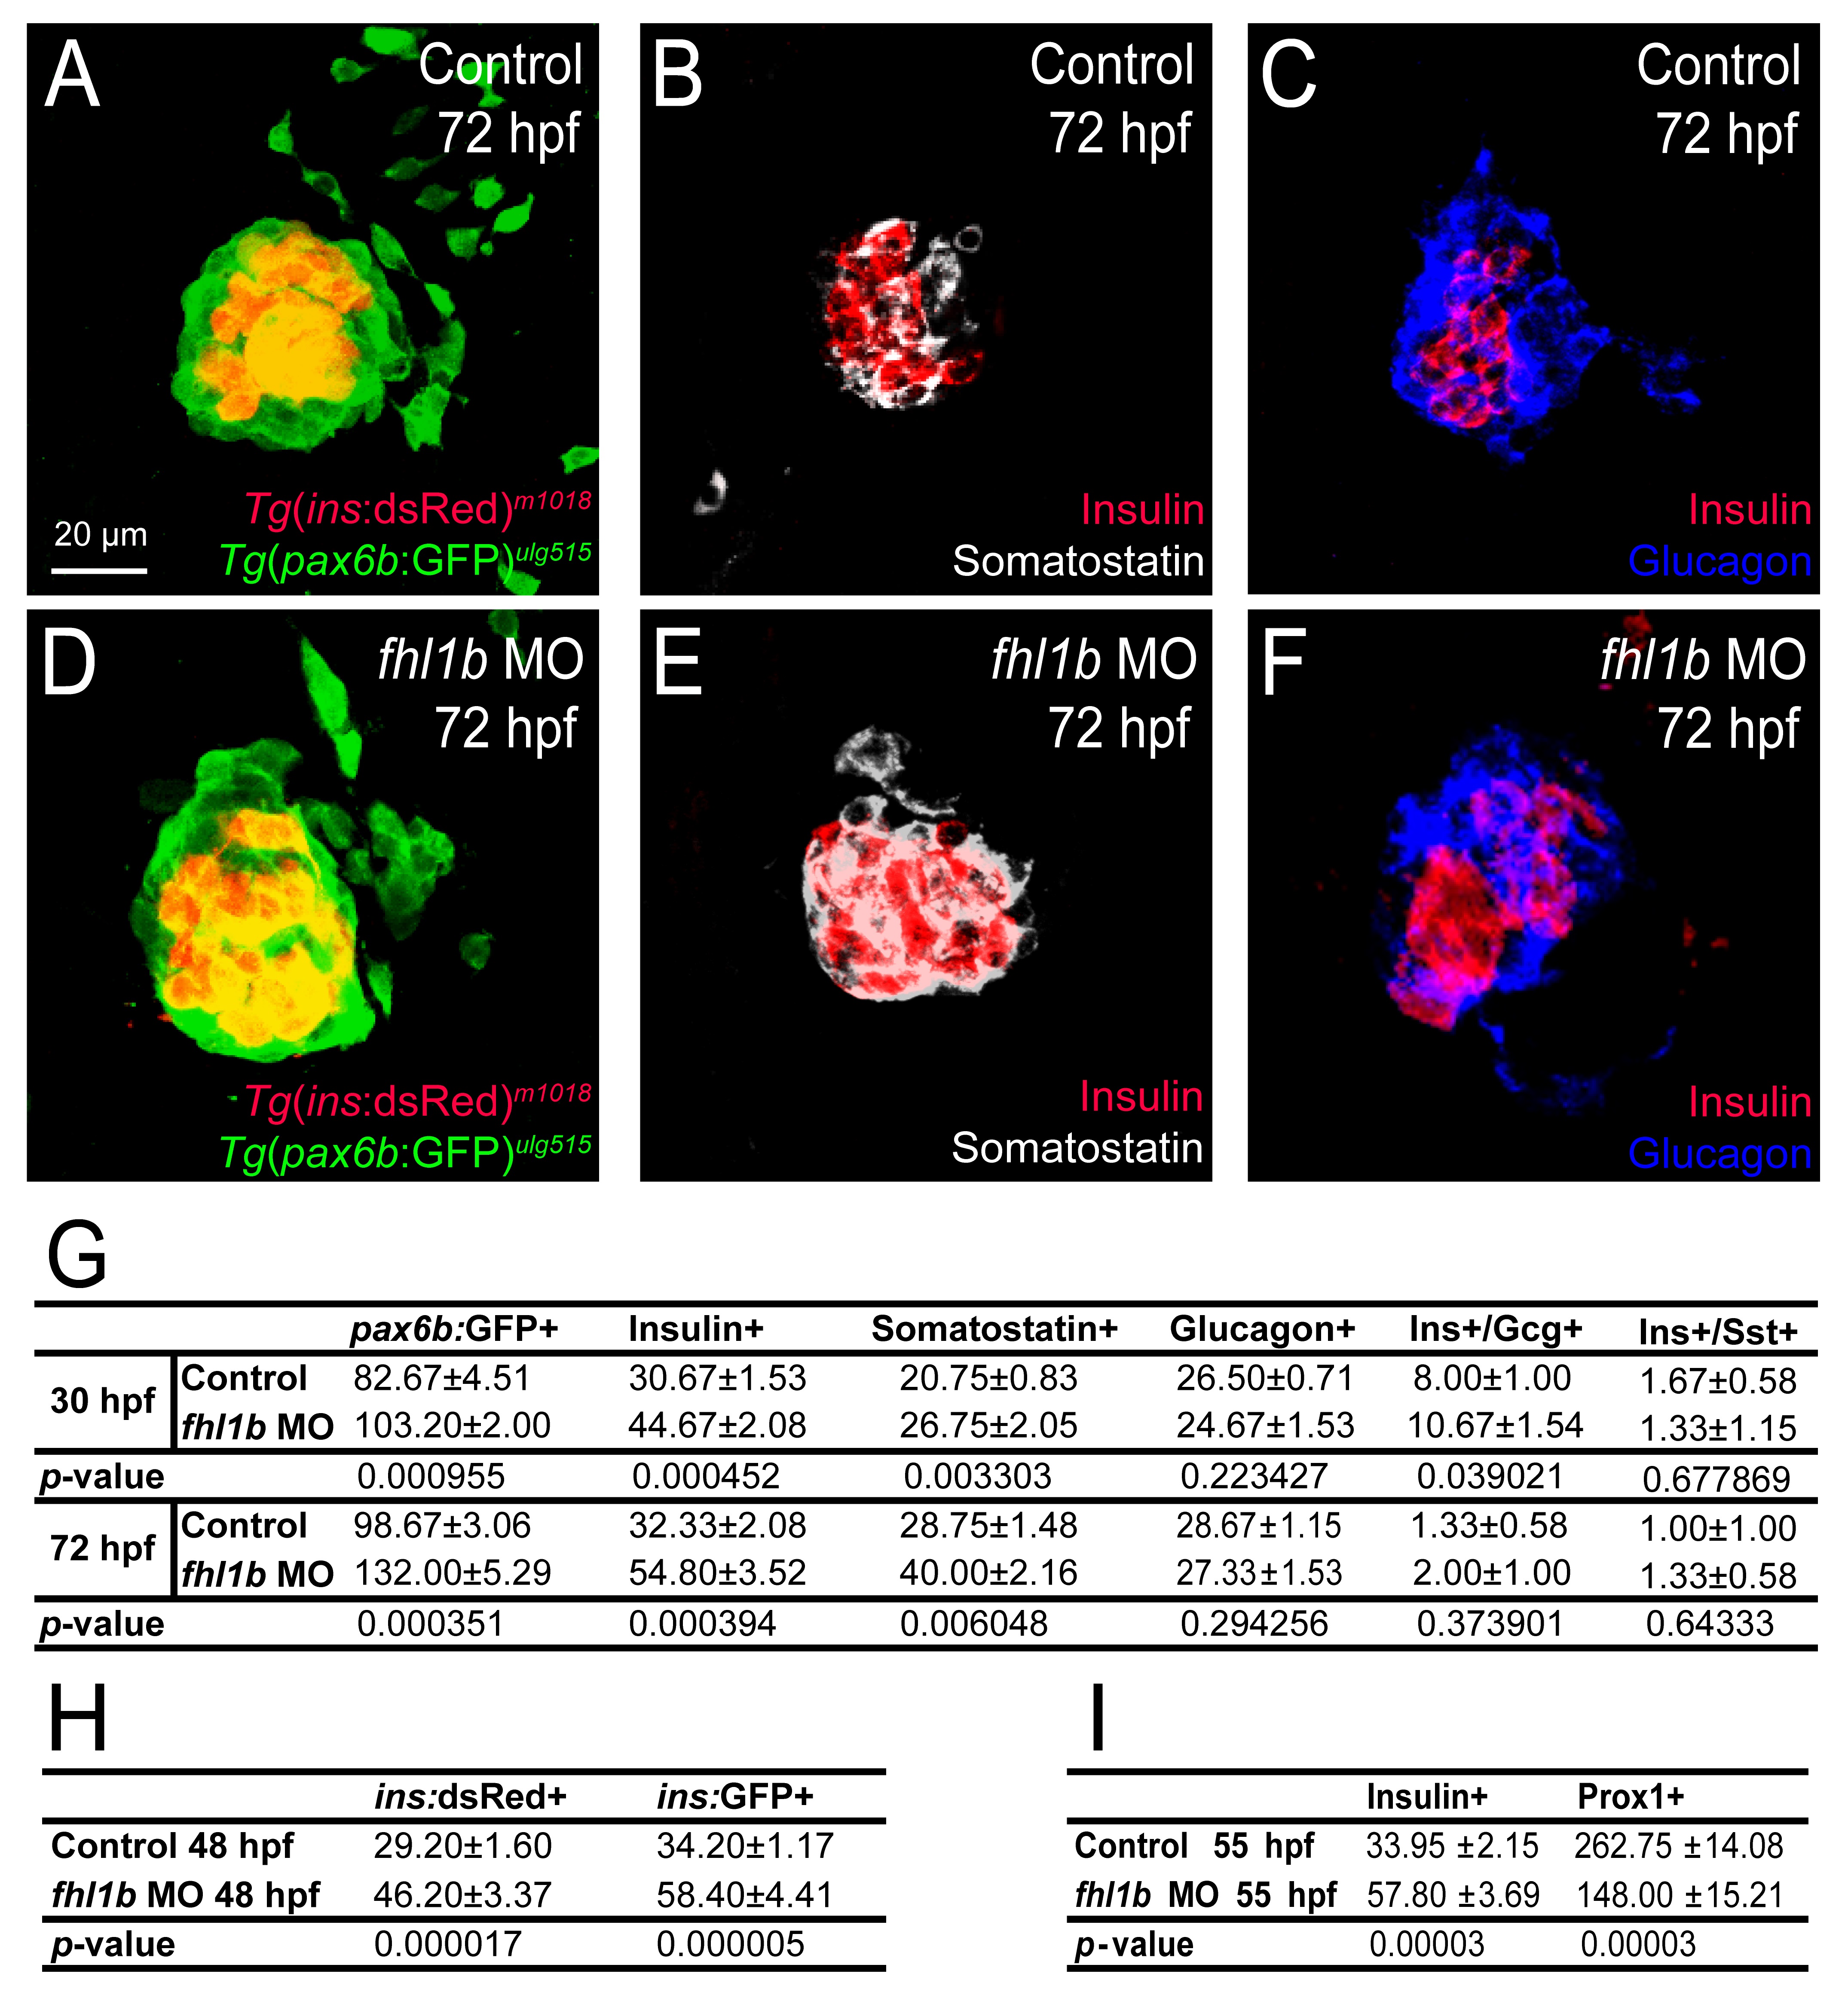
Decreased Fhl1b activity increases the number of pancreatic endocrine cells.
(A-F) Confocal images showing Tg(ins:dsRed)m1018 (A and D) or Insulin (B-C, E-F, red) expression with Tg(P0-pax6b:GFP)ulg515 (A and D, green), Somatostatin (B and E, grey), or Glucagon (C and F, blue) expression at 72 hpf, comparing control embryos (A-C) and fhl1b morphants (D-F). The number of Tg(ins:dsRed)m1018- or Insulin-expressing cells was significantly increased in fhl1b morphants (D-F) compared to that of control embryos (A-C). The number of Tg(P0-pax6b:GFP)ulg515- and Somatostatin-expressing cells was also increased (D and E, respectively), whereas that of Glucagon-expressing cells appeared unaffected (F) in fhl1b morphants compared to control embryos (A, B, and C, respectively). (G) Quantification of the number (mean±SD) of total and individual pancreatic endocrine hormone-expressing cells, comparing control embryos and fhl1b morphants at 30 and 72 hpf. (H) Quantification of the number (mean±SD) of dsRed- and GFP-positive β-cells, comparing control embryos and fhl1b morphants at 48 hpf. (I) Quantification of the number (mean±SD) of Insulin-positive cells in the pancreas and Prox1-positive cells in the liver at 55 hpf. A-F, confocal projection images, ventral views, anterior to the top. G-I, cells in 20 planes of confocal images from 5 individual embryos were counted. Scale bar, 20 µm.