
Image
|
Figure Caption
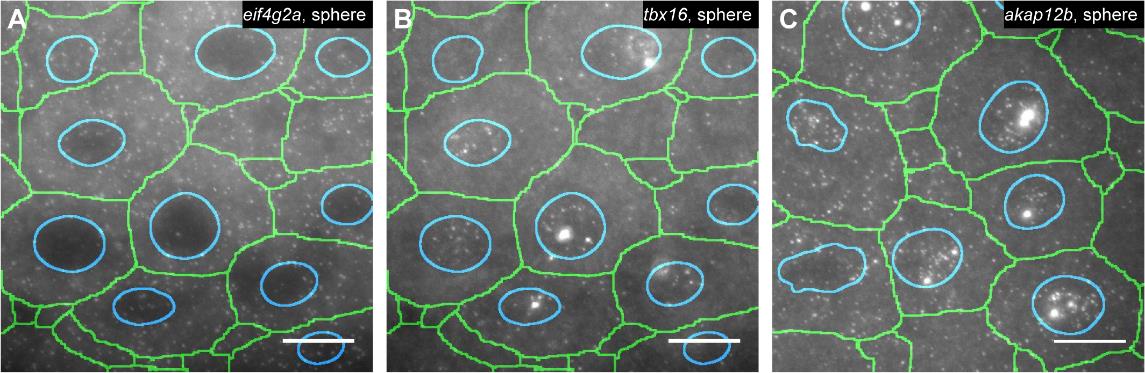
Fig. S10
Original smFISH images corresponding to Fig. 4. eif4g2a (A), tbx16 (B), and akap12b (C) at sphere stage. Green, cell outlines; blue, nuclear outlines. Scale bars: 10 µm. smFISH detections are maximum projections of 17 z-slices spaced by 0.3 µm.
Acknowledgments
This image is the copyrighted work of the attributed author or publisher, and
ZFIN has permission only to display this image to its users.
Additional permissions should be obtained from the applicable author or publisher of the image.
Full text @ Development