
|
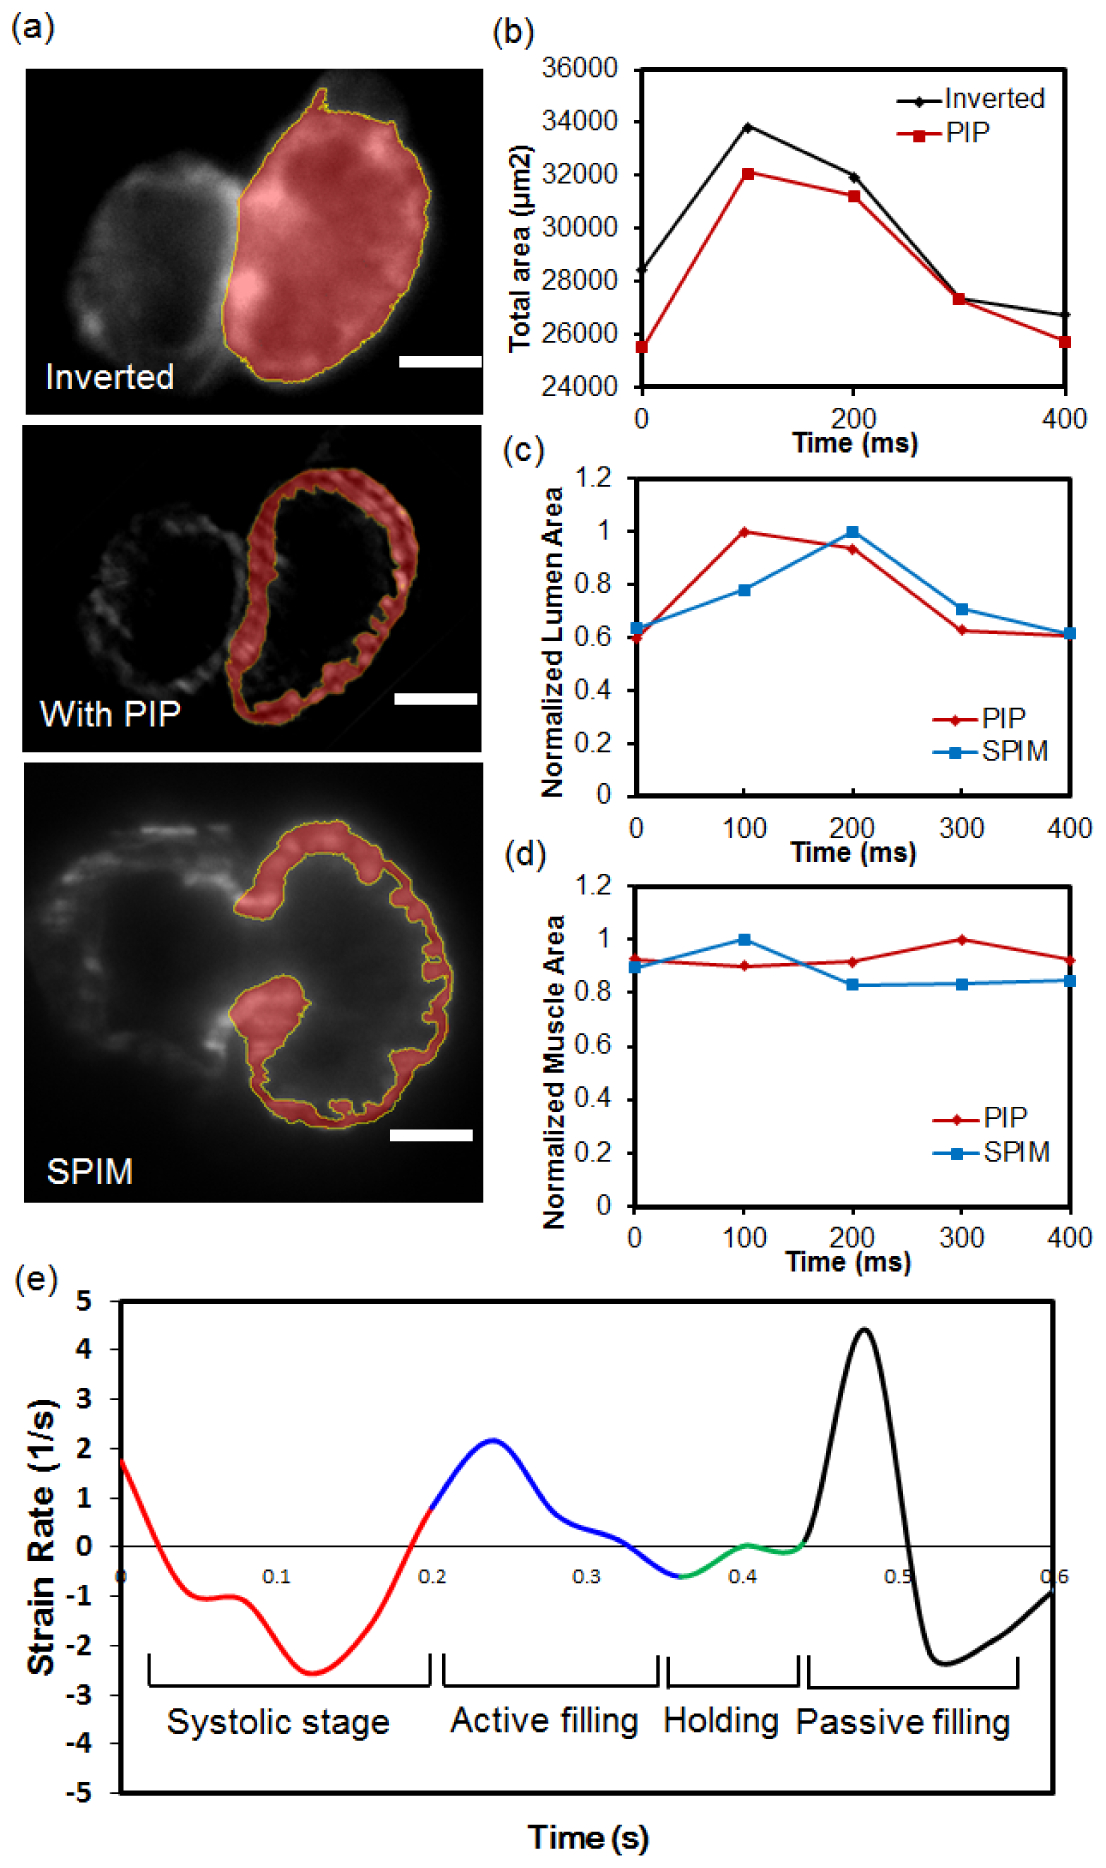
Fig. 5
Quantifying the area dynamics of beating embryonic zebrafish heart. (a) Segmentation of the ventricle’s inner and outer boundary. In the wide-field fluorescent image, due to the out-of-focus blur, only the outer boundary of the ventricle can be identified (yellow line). In PIP and SPIM images, by significantly enhancing image contrast, the inner boundary as well as ventricle’s myocardium structure (red area) can be accurately segmented. Scale bars in all sub-graphs are 50 µm. (b) The calculated area variation of the complete ventricle area in 400 millisecond time. (c) The normalized area change of the inside fluid domain, which is only enabled in PIP and SPIM image results. (d) The corresponding area change of the segmented ventricle muscle during heart beating. (e) The strain rate of the beating embryonic zebrafish heart during a cardiac cycle. The strain under each time point was calculated based on the girth variation of the ventricle inner boundary.