
|
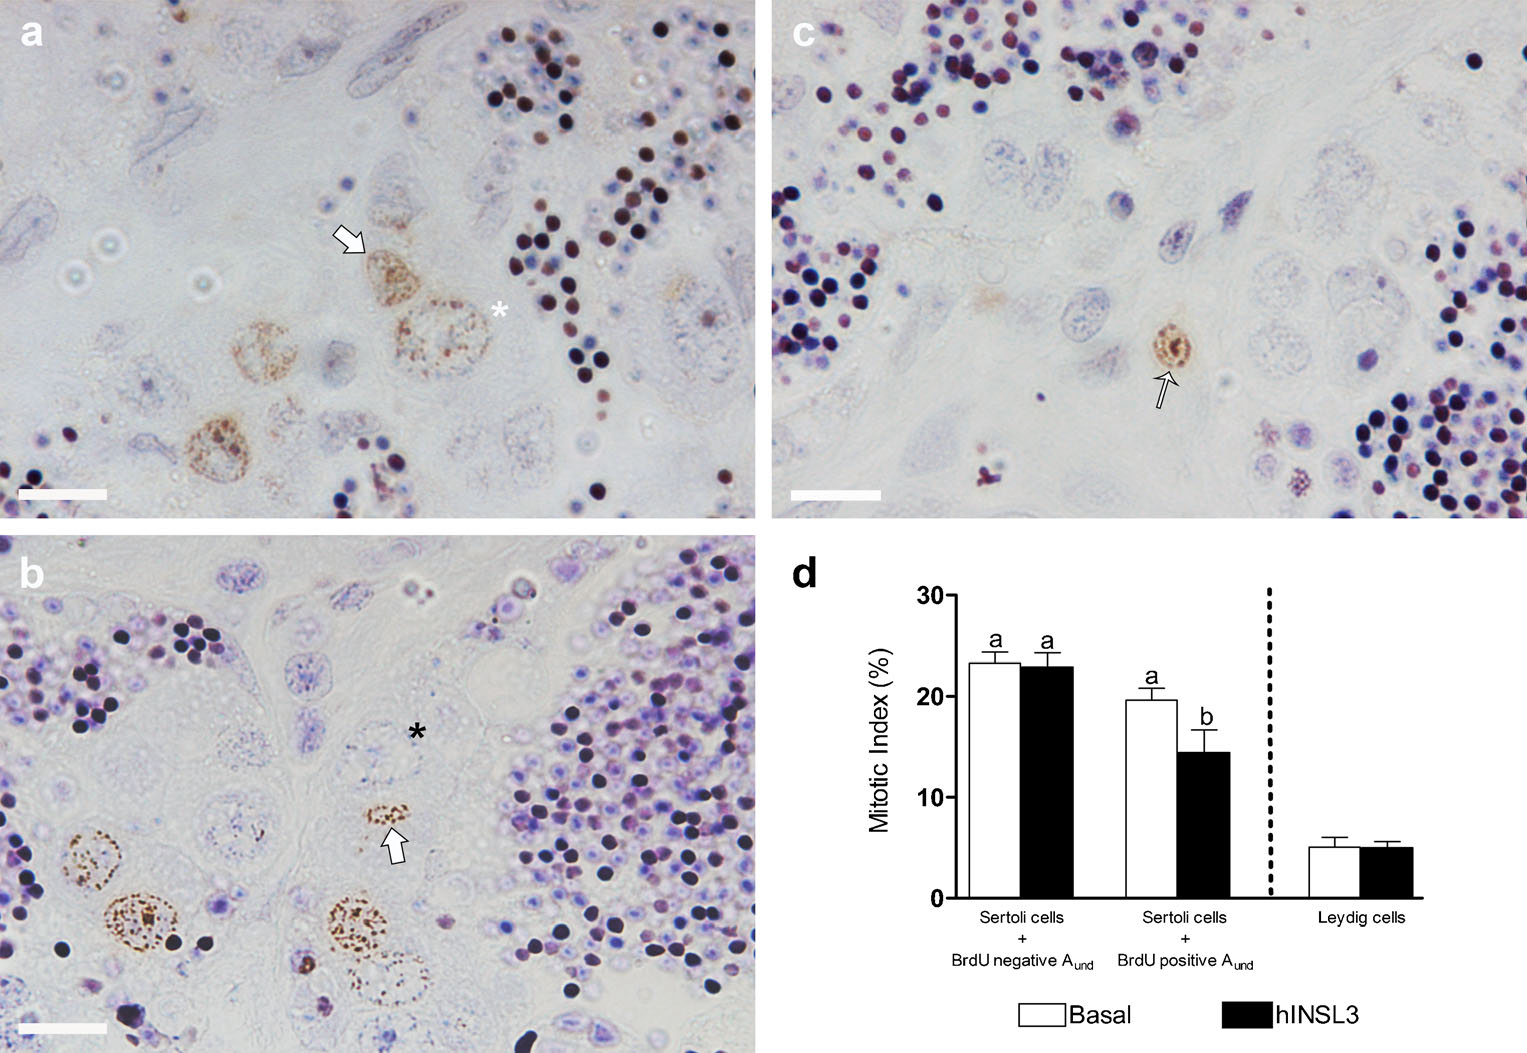
Fig. 3
a, b Testis tissue sections showing BrdU-positive Sertoli cells nuclei (arrows) in association with BrdU-positive (white star) and BrdU-negative (black star) type Aund spermatogonia. c BrdU-positive Leydig cell nucleus (thin arrow). d Mitotic indices of Sertoli cells in association with BrdU-negative or BrdU-positive type Aund spermatogonia and of Leydig cells after incubation for 7 days in the absence (Basal) or presence (hINSL3) of 100 ng hINSL3/ml. Different letters indicate significant differences (P < 0.05) between the absence and presence of hINSL3. Magnification ×1000 (a-c). Bars 10 µm. Results are presented as means ± SEM (n = 8)