
Fig. 6
- ID
- ZDB-IMAGE-160309-12
- Genes
- Publication
- Tang et al., 2016 - Imaging tumour cell heterogeneity following cell transplantation into optically clear immune-deficient zebrafish
- All Figures
- Figures for Tang et al., 2016
|
Fig. 6
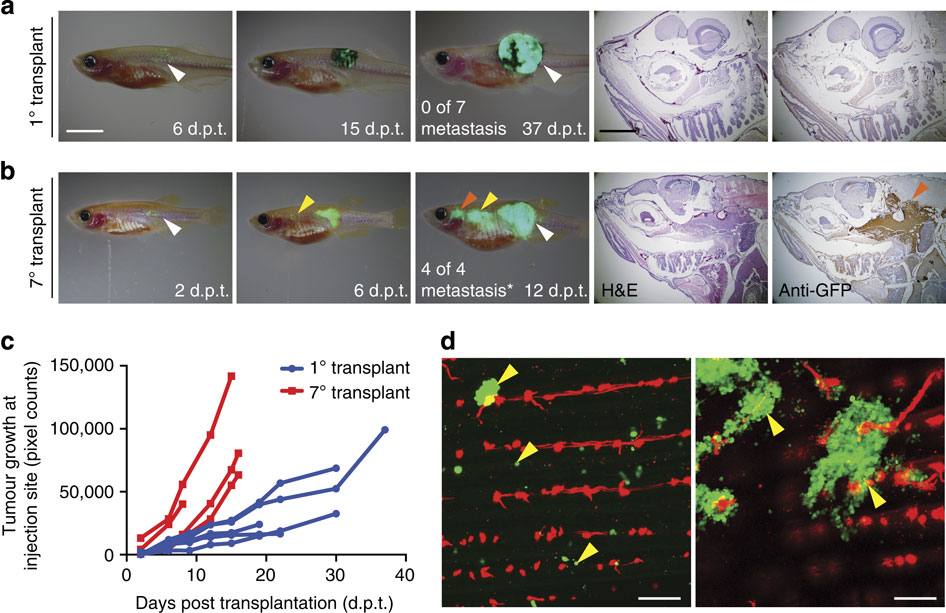
Assessing metastatic potential and the functional consequences of tumour evolution in melanoma.
(a,b) Serial imaging of engrafted GFP-labelled melanoma implanted into adult rag2E450fs (capser) mutant fish. The 1° transplant was pigmented (a), whereas the 7° transplanted melanoma had lost pigmentation (b). Number of animals with metastatic growth is noted (*P=0.003, Fisher’s exact test comparing 1° and 7° transplant). White arrow indicates the site of injection. Yellow and red arrows denote sites of distal metastases. Histological staining (H&E and anti-GFP) of distal metastasis is shown in the right panels. (c) Quantification of tumour growth at the site of initial engraftment over time. (d) Confocal imaging of micro-metastatic lesions found adjacent to the tail vasculature of flk1:mCherry; rag2E450fs (casper)-recipient fish engrafted with 7° transplant melanoma. Yellow arrows denote micro-metastatic lesions. Scale bars equal 5 mm for whole animal images in a,b, 2 mm for histology shown in a,b and 200 µm in d.