
Image
|
Figure Caption
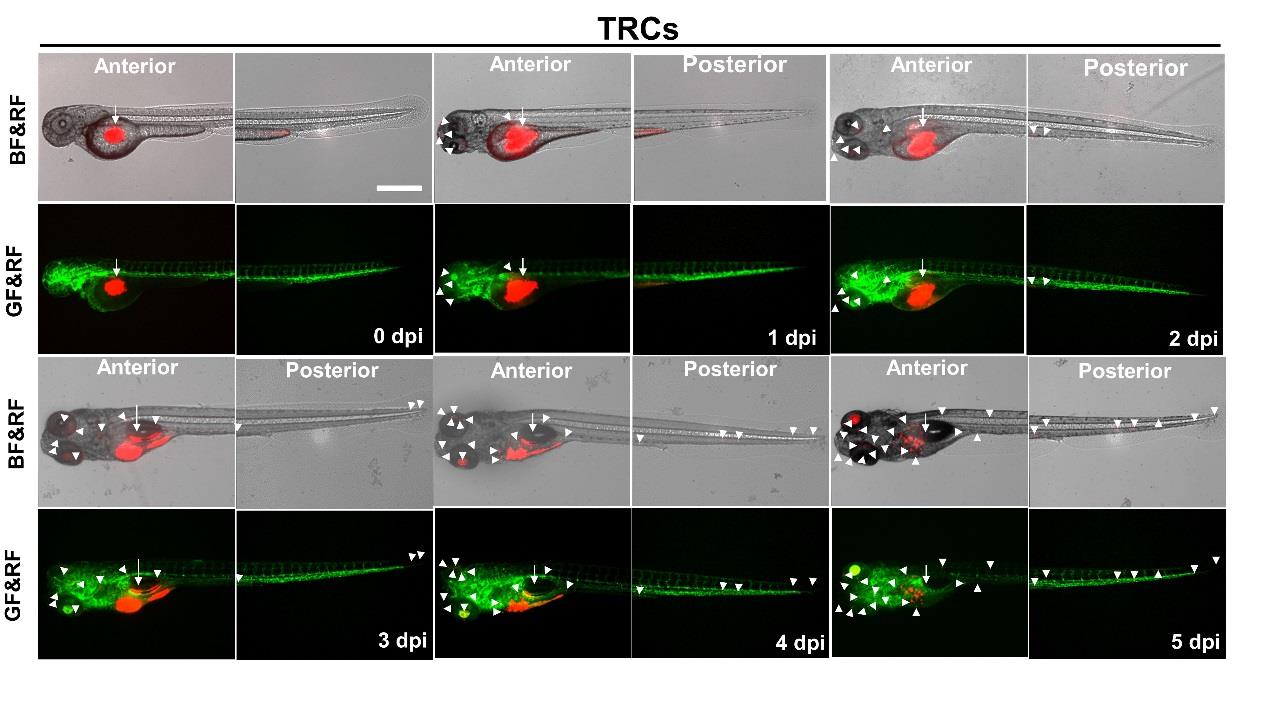
Fig. S5
Time-course analysis of metastasis of TRCs. The protocols and labels were identical to those in Supplementary Fig. 2 except that TRCs were injected. Scale bars, 500 µm.
Acknowledgments
This image is the copyrighted work of the attributed author or publisher, and
ZFIN has permission only to display this image to its users.
Additional permissions should be obtained from the applicable author or publisher of the image.
Full text @ Sci. Rep.