Fig. 2
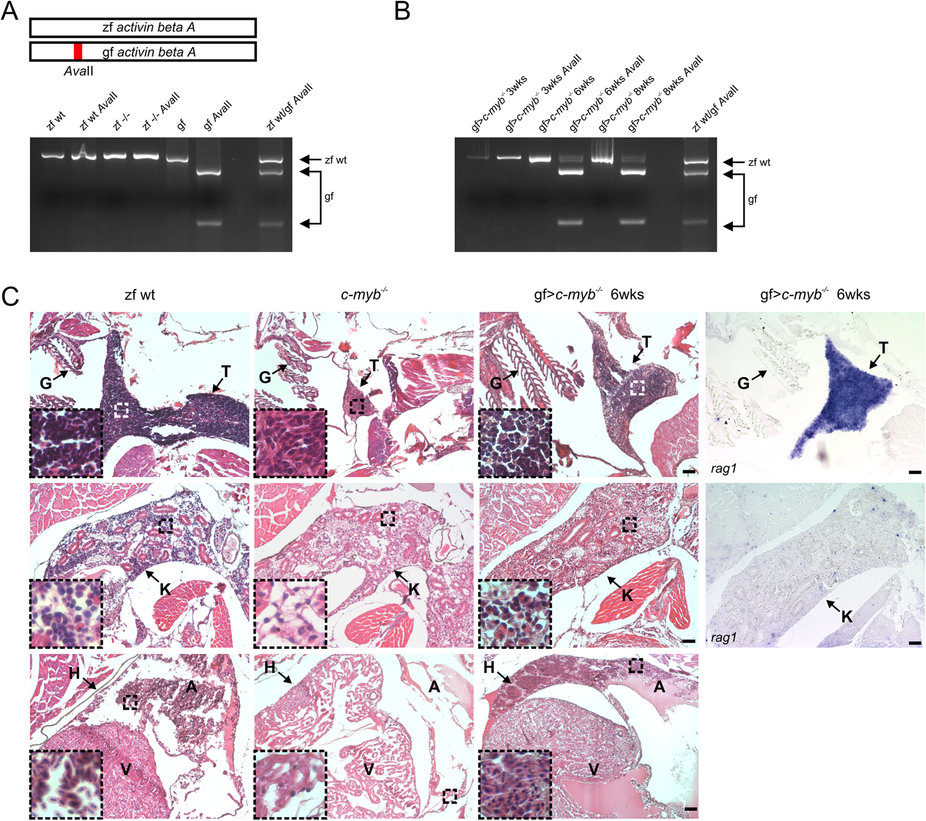
Multilineage hematopoietic reconstitution of c-myb mutant zebrafish after transplantation of goldfish whole kidney marrow cells.(A) Genotyping of whole kidney marrow cells of fish of indicated genotypes. The schematic at the top highlights the AvaII restriction site distinguishing zebrafish and goldfish sequences of the activin beta A gene (c.f. Supplementary Fig. 2A). Amplicons are shown before and after AvaII digestion of wild type zebrafish (zf wt), c-myb mutant zebrafish (zf-/-), and goldfish (gf). The AvaII digest of an amplicon generated from a 1+1 mixture of wild type zebrafish and goldfish cells is also shown on the right for reference. (B) Genotyping of whole kidney marrow cells of c-myb mutant zebrafish reconstituted with goldfish whole kidney marrow cells (gf > c-myb-/-) at several time points (in weeks) after transplantation. (C) Histological analysis of reconstituted c-myb mutant animals. Sections of the thymus (top panels), kidney (middle panels), and heart (bottom panels) are shown; insets represent 4× higher magnifications (haematoxylin/eosin staining) with the origin of selected regions indicated by broken squares (see also Supplementary Fig. 3). The fourth column indicates the results of RNA in situ hybridization using a rag1 probe, detecting lymphoid progenitor cells actively rearranging antigen receptor loci. Wild type zebrafish (zf wt), c-myb mutant (c-myb-/-), and c-myb mutant transplanted with goldfish whole kidney marrow cells 6 weeks after transplantation (gf > c-myb-/-). All fish are 12 weeks old. Anatomical landmarks are indicated (G, gills; T, thymus; K, kidney; H, heart; A, atrium of the heart; V, ventricle of the heart). Scale bars, 50 µm.

