
Image
|
Figure Caption
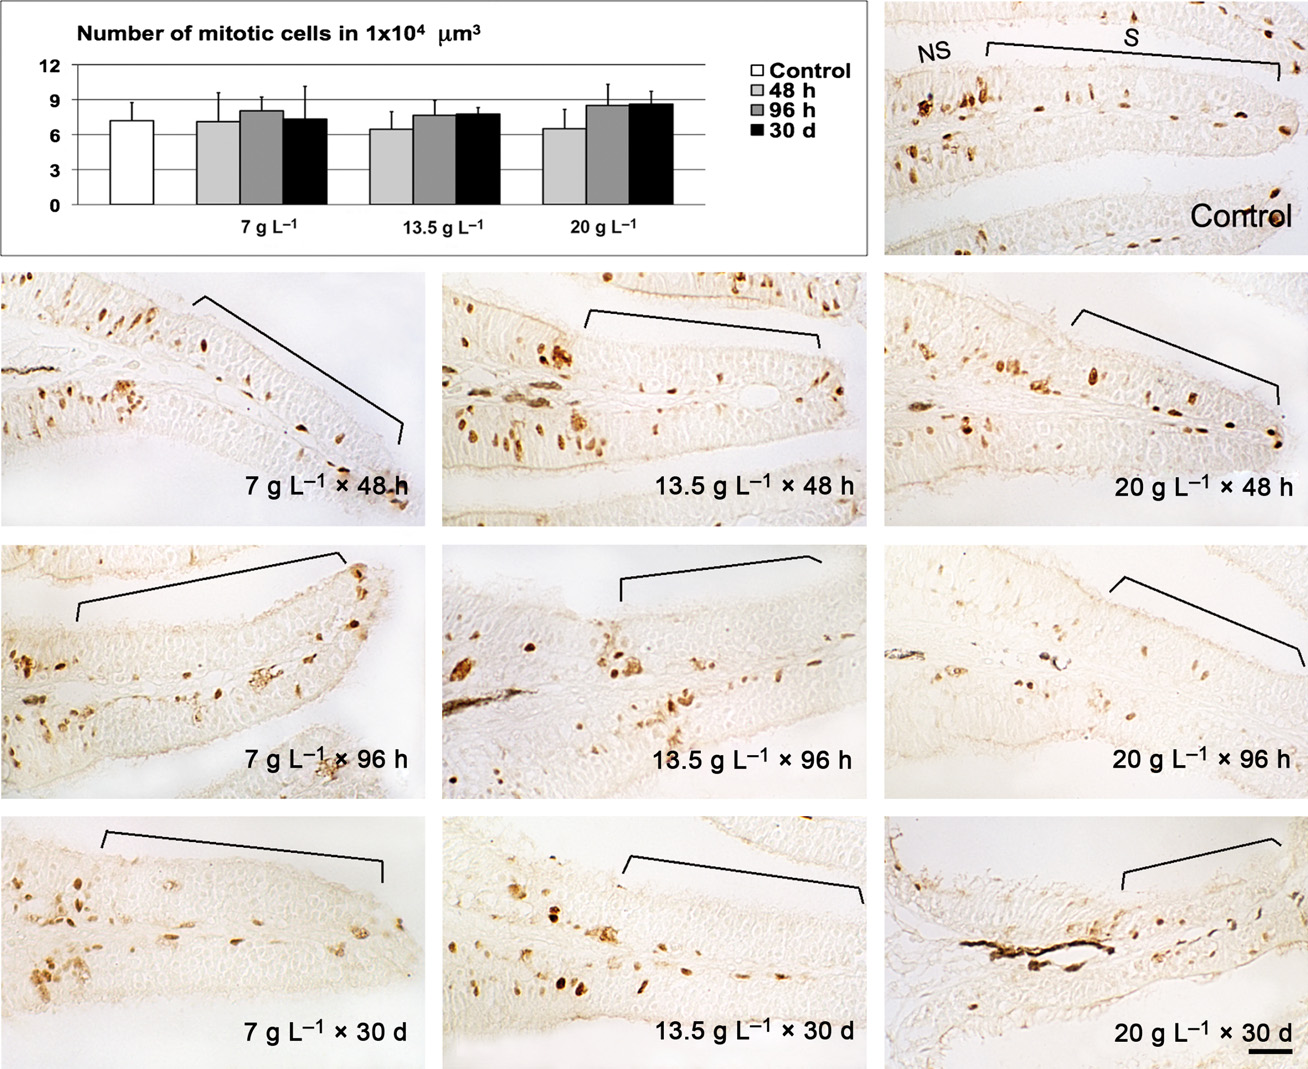
Fig. 6
PCNA immunohistochemistry. (A) Density of dividing cells and comparison between controls and treatments. (B) Representative micrograph of control tissue. (C1–3) Representative micrographs of lamellae exposed to 7 g L-1 of urea. (D1–3) Representative micrographs of lamellae exposed to 13.5 g L-1 of urea. (E1–3) Representative micrographs of lamellae exposed to 20 g L-1 of urea. NS, non sensory epithelium; S, sensory epithelium. Scale bar: 20 µm.
Acknowledgments
This image is the copyrighted work of the attributed author or publisher, and
ZFIN has permission only to display this image to its users.
Additional permissions should be obtained from the applicable author or publisher of the image.
Full text @ J. Anat.