
Fig. S2
- ID
- ZDB-IMAGE-160212-8
- Publication
- Abu-Siniyeh et al., 2016 - The aPKC/Par3/Par6 polarity complex and membrane order are functionally inter-dependent in epithelia during vertebrate organogenesis
- All Figures
- Figures for Abu-Siniyeh et al., 2016
|
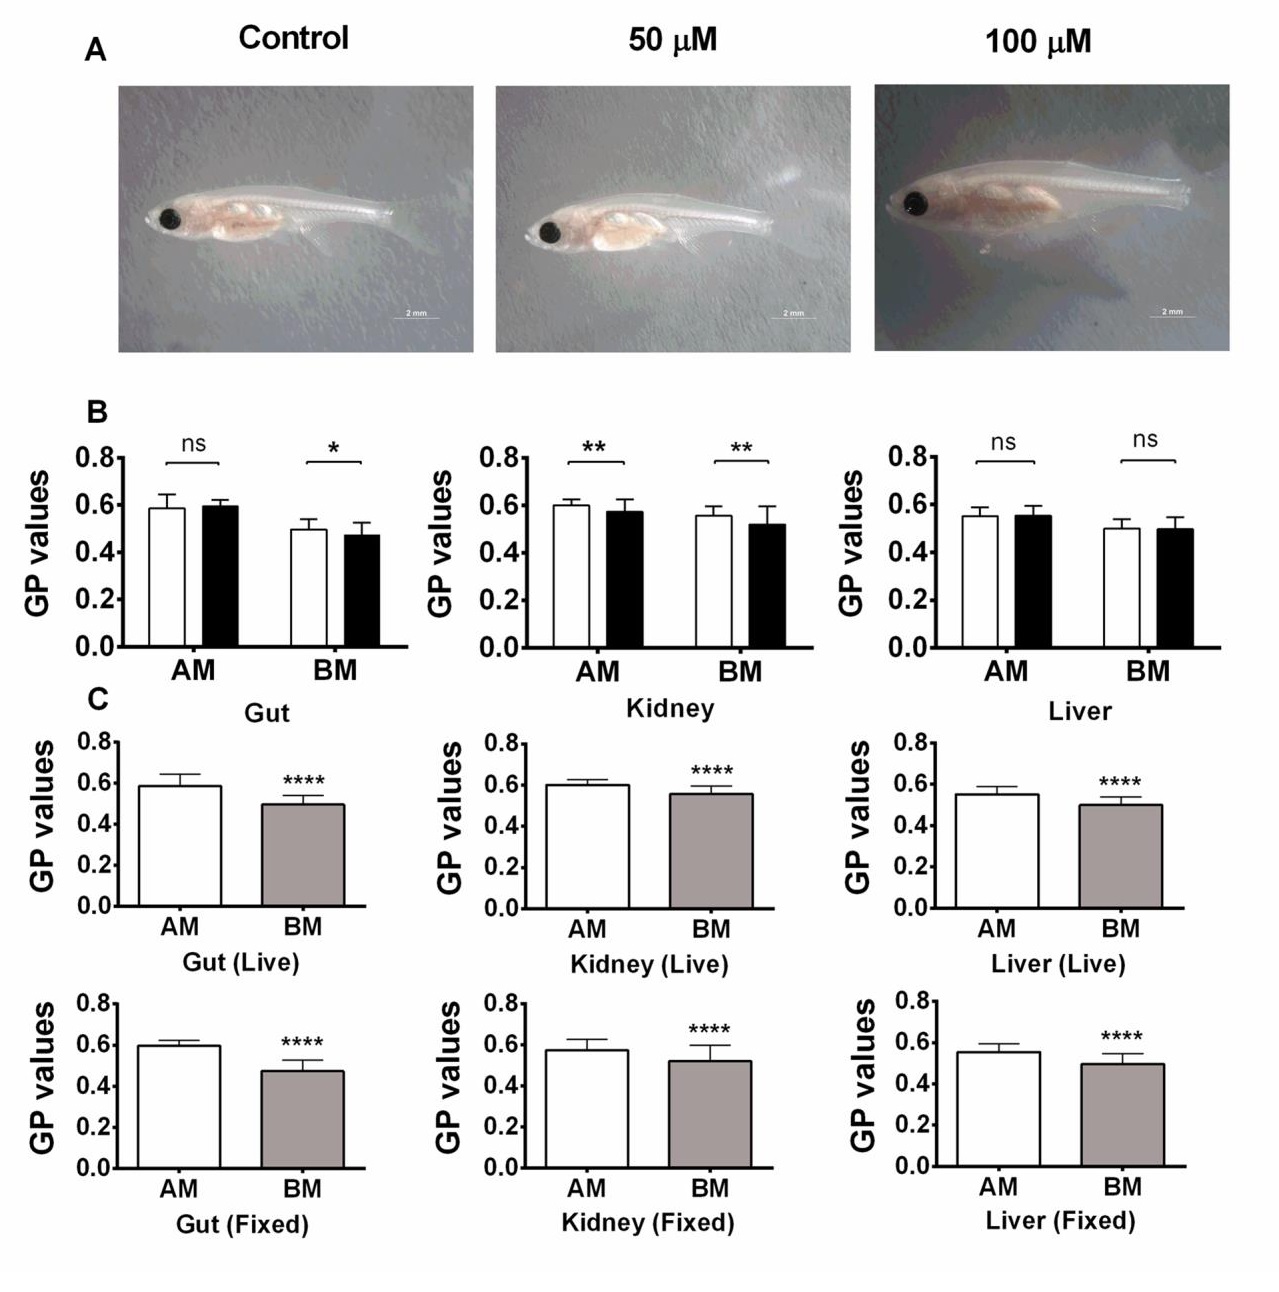
Fig. S2
Laurdan microscopy for zebrafish larvae. A) Zebrafish larvae were treated with 0 µm (i) 50 µm (ii) or 100 µm (iii) Laurdan at 3 dpf with for 30 min, then washed and grown to 1-month-old fish. Photographs were taken with a standard digital camera. Scale bars = 2 mm. B–C) Comparison of Laurdan GP values of the apical (AM) and basolateral (BM) membranes of gut, kidney and liver of 6 dpf zebrafish larvae that were imaged live (white bars in B) and after fixation with paraformaldehyde (black bars in B). Data are mean and standard deviations of 50 regions of interests obtained in 10 larvae. In (B), ns, not significant, p > 0.05; *p < 0.05; **p < 0.01 between fixed and live larvae. In (C), ****p < 0.0001 between apical (AM) and basolateral (BM) membranes in live and fixed larvae (Student t-test).