
Fig. S3
- ID
- ZDB-IMAGE-160212-38
- Publication
- Beerman et al., 2015 - Direct In Vivo Manipulation and Imaging of Calcium Transients in Neutrophils Identify a Critical Role for Leading-Edge Calcium Flux
- All Figures
- Figures for Beerman et al., 2015
|
Fig. S3
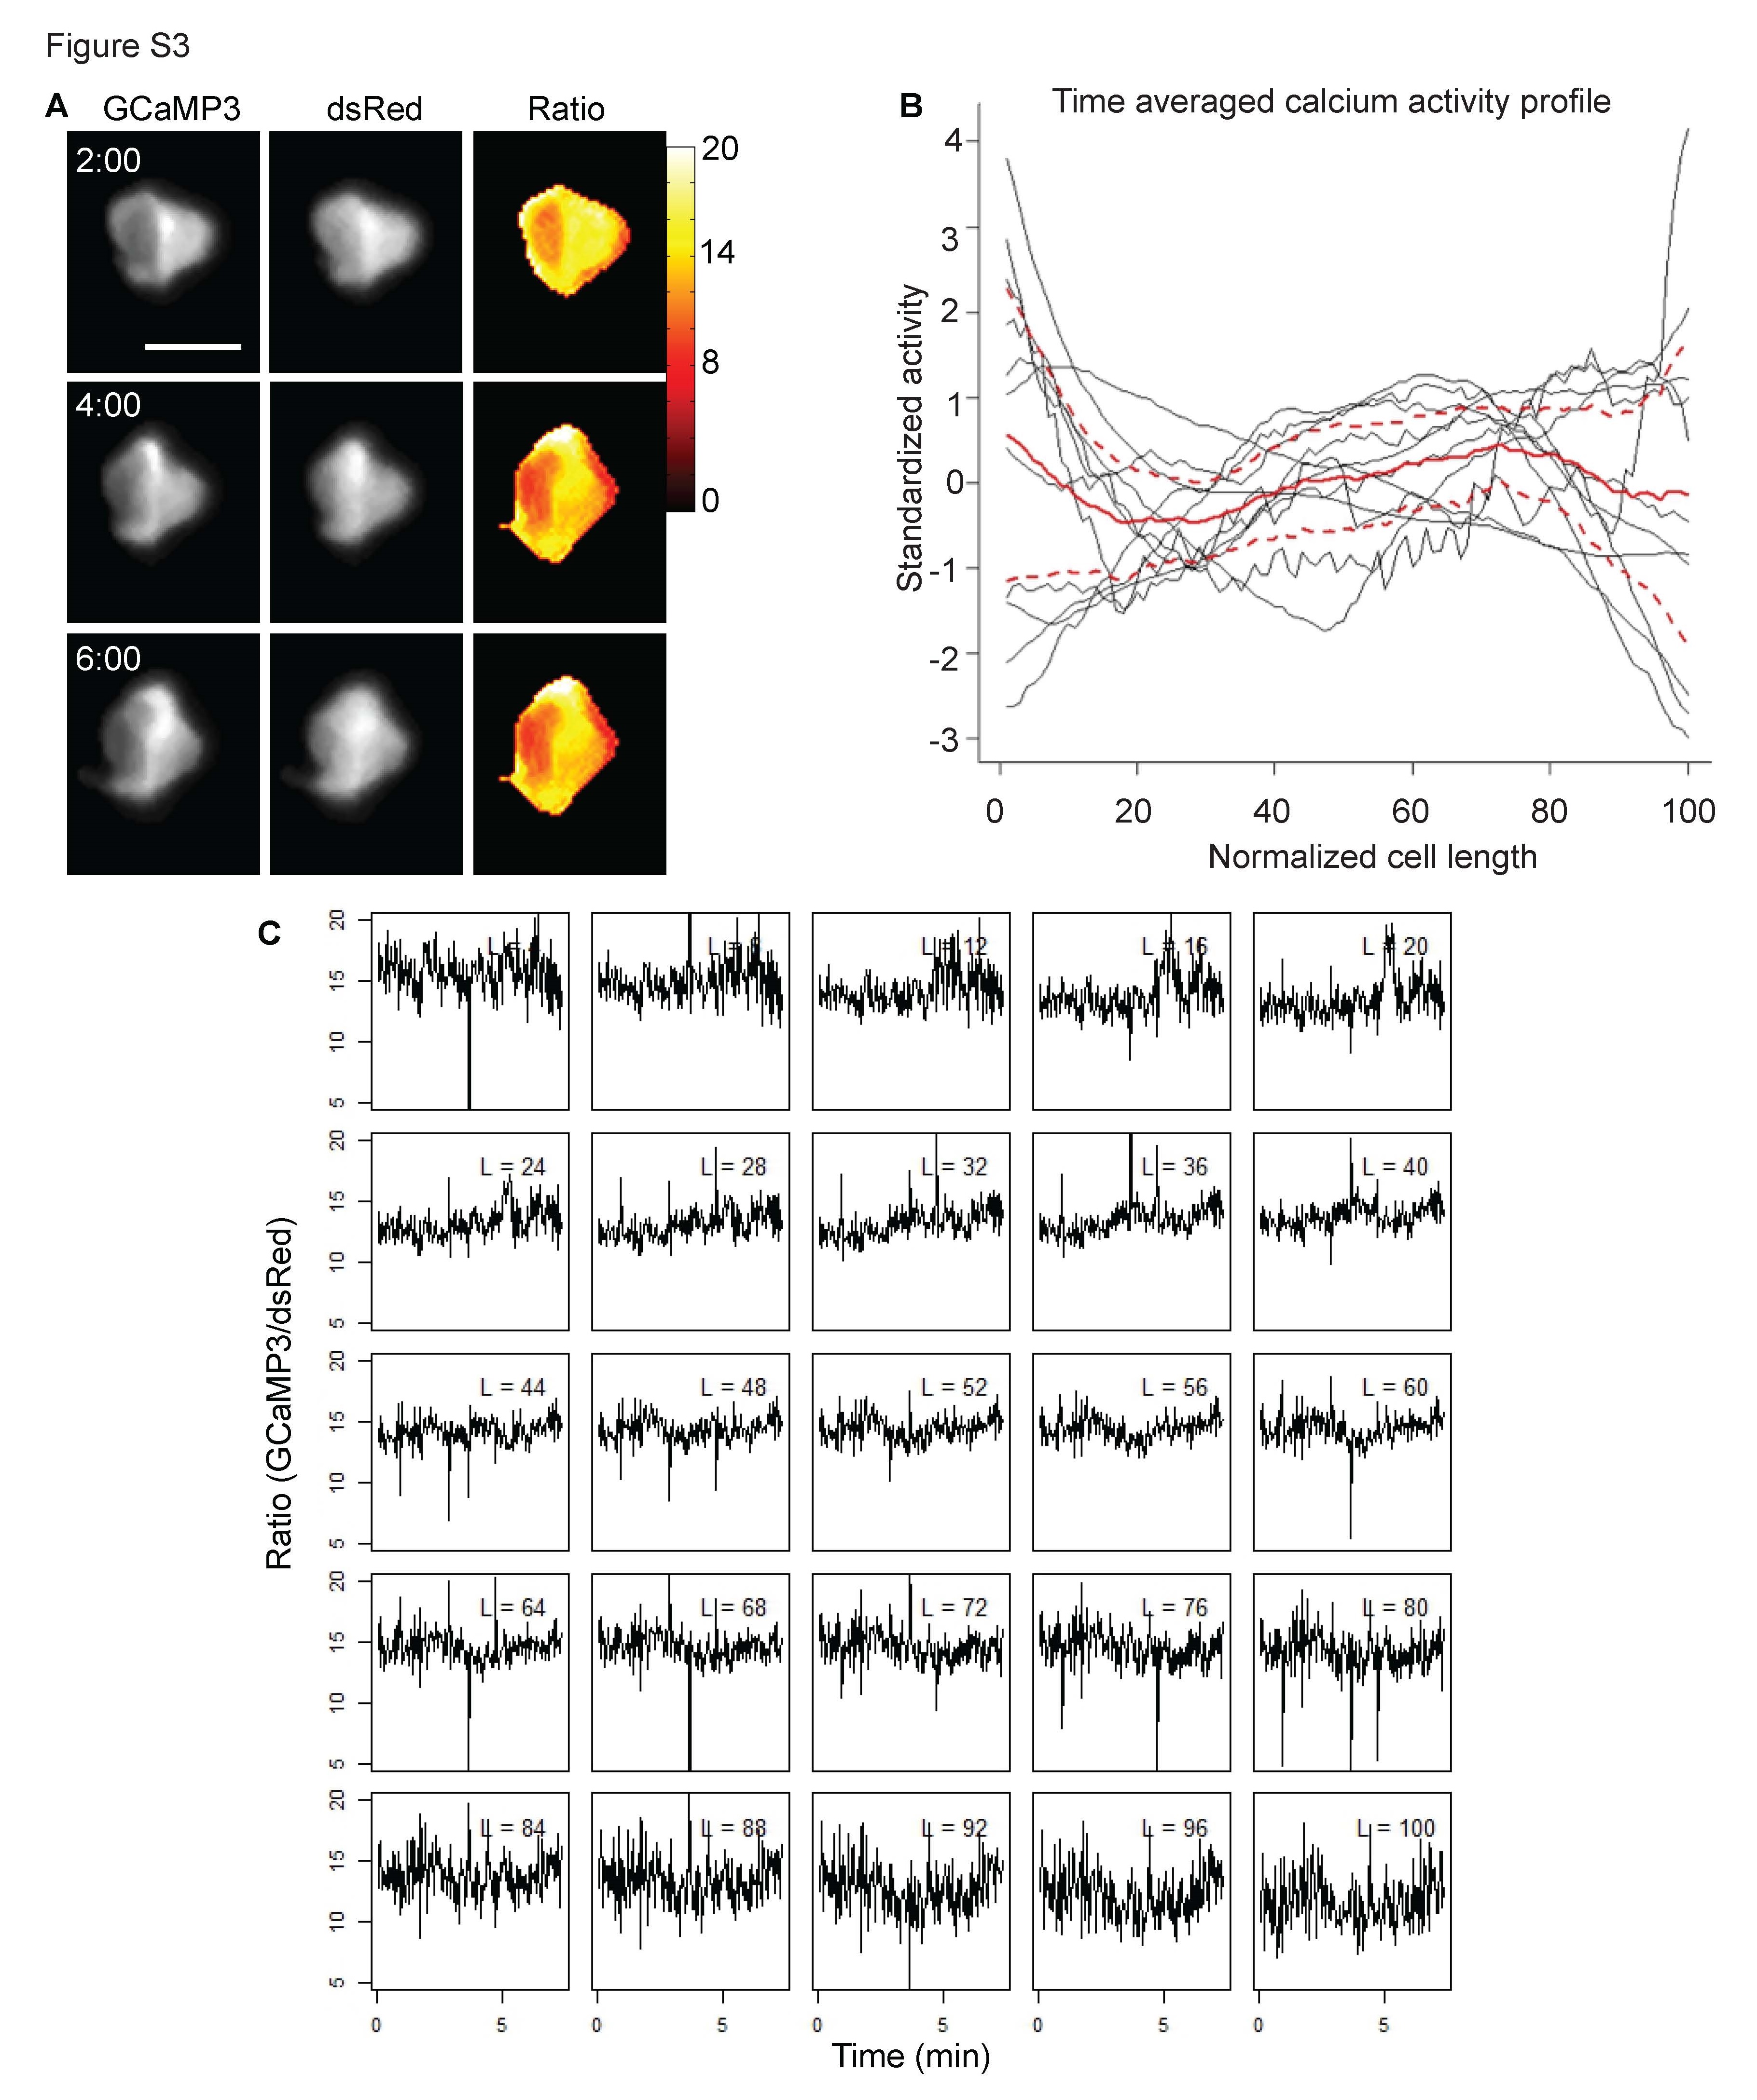
(Relates to Figure 1). Stationary neutrophils do not exhibit a distinguishable pattern of calcium localization.
(A) Still frames from time-lapse microscopy show a stationary neutrophil in a Tg(LysC:GCaMP3; LysC:dsRed) larva after a caudal fin wound. Each channel was captured sequentially (GCaMP3 or dsRed) and the resulting ratiometric image is GCaMP3/dsRed. t=0 corresponds to approximately 40 min post wounding. The scale bar is 10µm.
(B) Summary graph displays the time-averaged calcium activity profile across the length of a stationary neutrophil (normalized to 100 units at each frame; 0 is edge most distal to wound and 100 is edge most proximal to the wound). Each individual neutrophil is graphed in black (n=11 from 5 animals) with the average profile outlined in red and bound by the 95% confidence intervals (dashed red lines).
(C) Calcium activity profiles from stationary neutrophil in (A). The stationary cell was sectioned into 25 parts across its length (1-100 units), such that L=4 (the upper left hand box) displays the average GCaMP3/dsRed signal (y axis) across time (x axis, minutes) within the left-most (distal to wound) edge of the cell and L=100 corresponds to the right-most (proximal to wound) edge of the stationary cell.