
Fig. 3
- ID
- ZDB-IMAGE-160212-34
- Publication
- Beerman et al., 2015 - Direct In Vivo Manipulation and Imaging of Calcium Transients in Neutrophils Identify a Critical Role for Leading-Edge Calcium Flux
- All Figures
- Figures for Beerman et al., 2015
|
Fig. 3
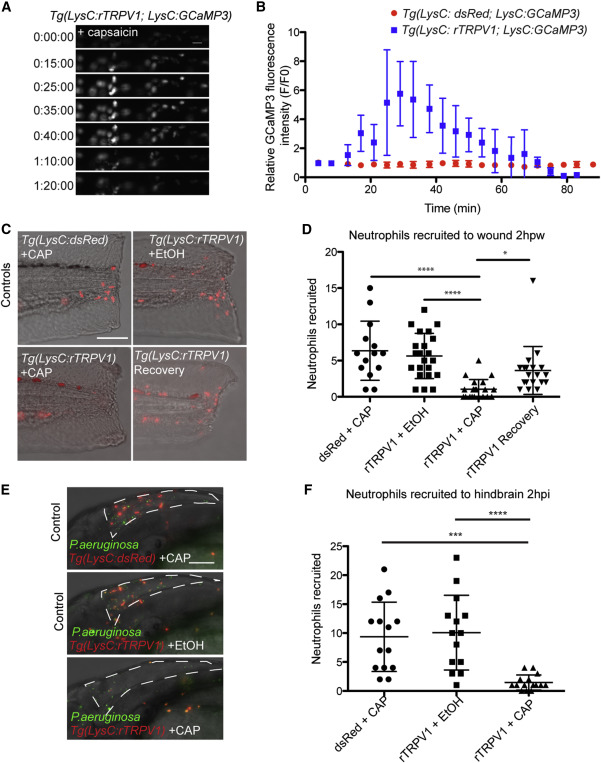
Regulated Calcium Flux Is Required for Neutrophil Recruitment
(A and B) Time-lapse experiment shows no change in GCaMP3 fluorescence in neutrophils from control Tg(LysC:dsRed; LysC:GCaMP3) larva after addition of capsaicin and increased GCaMP3 fluorescence in neutrophils from Tg(LysC:rTRPV1; LysC:GCaMP3) larva. (A) Selected still frames show GCaMP fluorescence in Tg(LysC:rTRPV1; LysC:GCaMP3) larva during extended exposure to capsaicin. t = 0 corresponds to 5 min after addition of capsaicin. Scale bar, 20 µm. (B) Quantification of the relative GCaMP fluorescence intensity (F/F0) during extended capsaicin treatment (n = 5 neutrophils for each larva). Error bars are mean ± SD. See also Movie S3.
(C–F) Tg(LysC:rTRPV1; LysC:GCaMP3) or Tg(LysC:dsRed; LysC:GCaMP3) larvae were wounded (C and D) or infected with P. aeruginosa in the hindbrain (E and F) and briefly pulsed with capsaicin (CAP) or soaked in ethanol (EtOH) for 2 hr before neutrophil recruitment was quantified. Recovery Tg(LysC:rTRPV1; LysC:GCaMP3) larvae were pulsed with CAP before wounding, followed by EtOH soak for 2 hr to assess neutrophil recovery after capsaicin treatment (C and D). (C) Representative maximum-intensity projections show red-fluorescent neutrophils merged with bright field at 2 hr post-wounding. (E) Representative maximum-intensity projections show red-fluorescent neutrophils and green-fluorescent P. aeruginosa at 2 hr post-infection within the hindbrain ventricle outlined by white dashed line. Scale bars, 100 µm. (D and F) Graphs display the number of neutrophils recruited for each larva. Error bars are mean ± SD. Kruskal-Wallis test followed by Dunn’s multiple comparison test: , adjusted p < 0.0001; , adjusted p = 0.0002; and , adjusted p = 0.014. Each experiment was carried out at least twice.