
Fig. 2
- ID
- ZDB-IMAGE-160212-33
- Publication
- Beerman et al., 2015 - Direct In Vivo Manipulation and Imaging of Calcium Transients in Neutrophils Identify a Critical Role for Leading-Edge Calcium Flux
- All Figures
- Figures for Beerman et al., 2015
|
Fig. 2
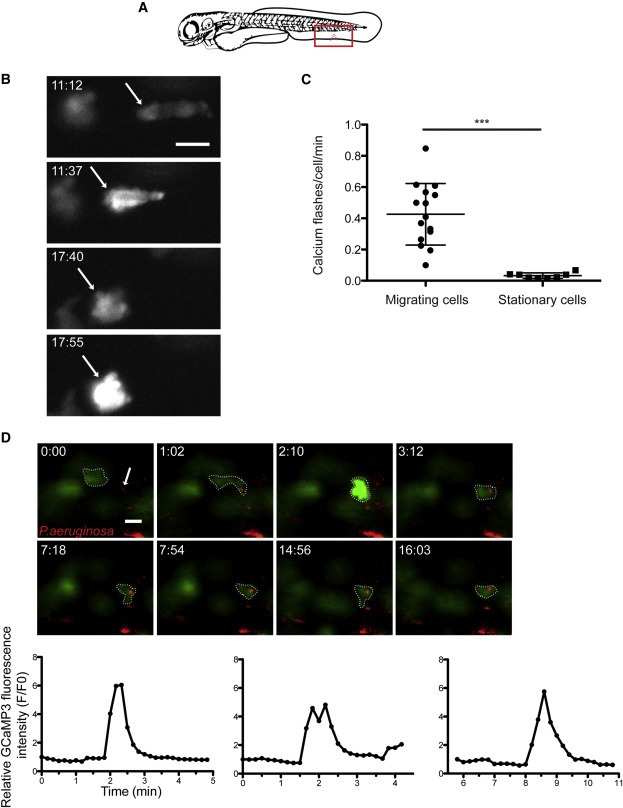
Neutrophils Undergo Whole-Cell Calcium Flux at Sites of Injury and upon Phagocytosis of Bacteria
(A) Cartoon of a ventral fin wound (red notch) and field of view during imaging (red square).
(B) Fluorescent images from a time-lapse following GCaMP3 expression in a neutrophil migrating toward a ventral fin wound in a Tg(LysC:GCaMP3) larva. t = 0 corresponds to 5 min post-wounding. Arrow highlights a single neutrophil as it periodically flashes during migration toward a ventral wound.
(C) Mean number of whole-cell calcium flashes per cell per minute during the first hour post-wounding in migrating neutrophils and stationary neutrophils. Error bars are mean ± SD. Mann-Whitney test p < 0.0001 (n = 15 cells from five larvae for migrating cells, and n = 8 cells from four larvae for stationary cells).
(D) Still frames from time-lapse capturing calcium flash upon LysC:GCaMP3 neutrophil (green) phagocytosis of P. aeruginosa (red). Dotted line surrounds the phagocytic neutrophil in each frame, and the arrow highlights bacteria that will be phagocytosed. t = 0 corresponds to 30 min post-infection. Scale bars, 10 µm. Graphs quantify the increase in relative fluorescence intensity from GCaMP3 (F/F0) during phagocytosis of PAO1. Left graph corresponds to the panels above, and the center and right graphs correspond to additional examples shown in Movie S2, parts 3 and 4, respectively.
See also Movie S2.