
Fig. 1
- ID
- ZDB-IMAGE-160212-32
- Publication
- Beerman et al., 2015 - Direct In Vivo Manipulation and Imaging of Calcium Transients in Neutrophils Identify a Critical Role for Leading-Edge Calcium Flux
- All Figures
- Figures for Beerman et al., 2015
|
Fig. 1
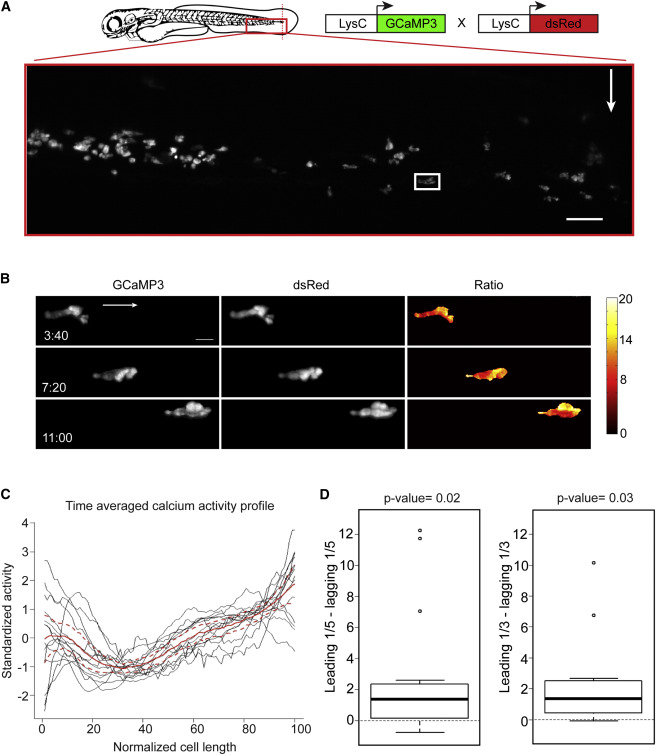
Calcium Is Enriched at the Leading Edge of Migrating Neutrophils In Vivo
(A) Illustration of a caudal fin amputation (red dotted line) in a double-transgenic larva Tg(LysC:GCaMP3; LysC:dsRed) with the field of view in the red box. White arrow indicates fin amputation, and white box highlights the neutrophil in the still frames in (B). Scale bar, 50 µm.
(B) Maximum-intensity projections from time-lapse experiments with light-sheet fluorescence microscopy follow a single neutrophil migrating toward wound, displaying image data from each channel (GCaMP3 or dsRed) and resulting ratiometric image (GCaMP3/dsRed). Arrow indicates overall direction of migration. t = 0 corresponds to 40 min post-wounding. Scale bar, 10 µm.
(C) Time-averaged calcium activity profile across the length of a migrating neutrophil (normalized relative to direction of migration, where 0 is the lagging edge and 100 is the leading edge). Each neutrophil is graphed in black (n = 15, from four animals) with the mean profile (red line), bound by 95% confidence intervals (dashed red lines).
(D) Left box plot shows the difference between the average calcium signal at the leading and lagging edge (one-fifth of the length) for each neutrophil examined in (C). Middle line is the median, the box is the middle 50%, and the upper and lower bars indicate data range, with outliers as dots. Calculations were also repeated using the leading and lagging one-third of each cell (right box plot). Hypothesis that the average difference was positive was tested using a one-sample t test.
See also Figures S1–S3 and Movie S1.