
Fig. 5
- ID
- ZDB-IMAGE-160212-27
- Publication
- Goi et al., 2016 - Patterning Mechanisms of the Sub-Intestinal Venous Plexus in Zebrafish
- All Figures
- Figures for Goi et al., 2016
|
Fig. 5
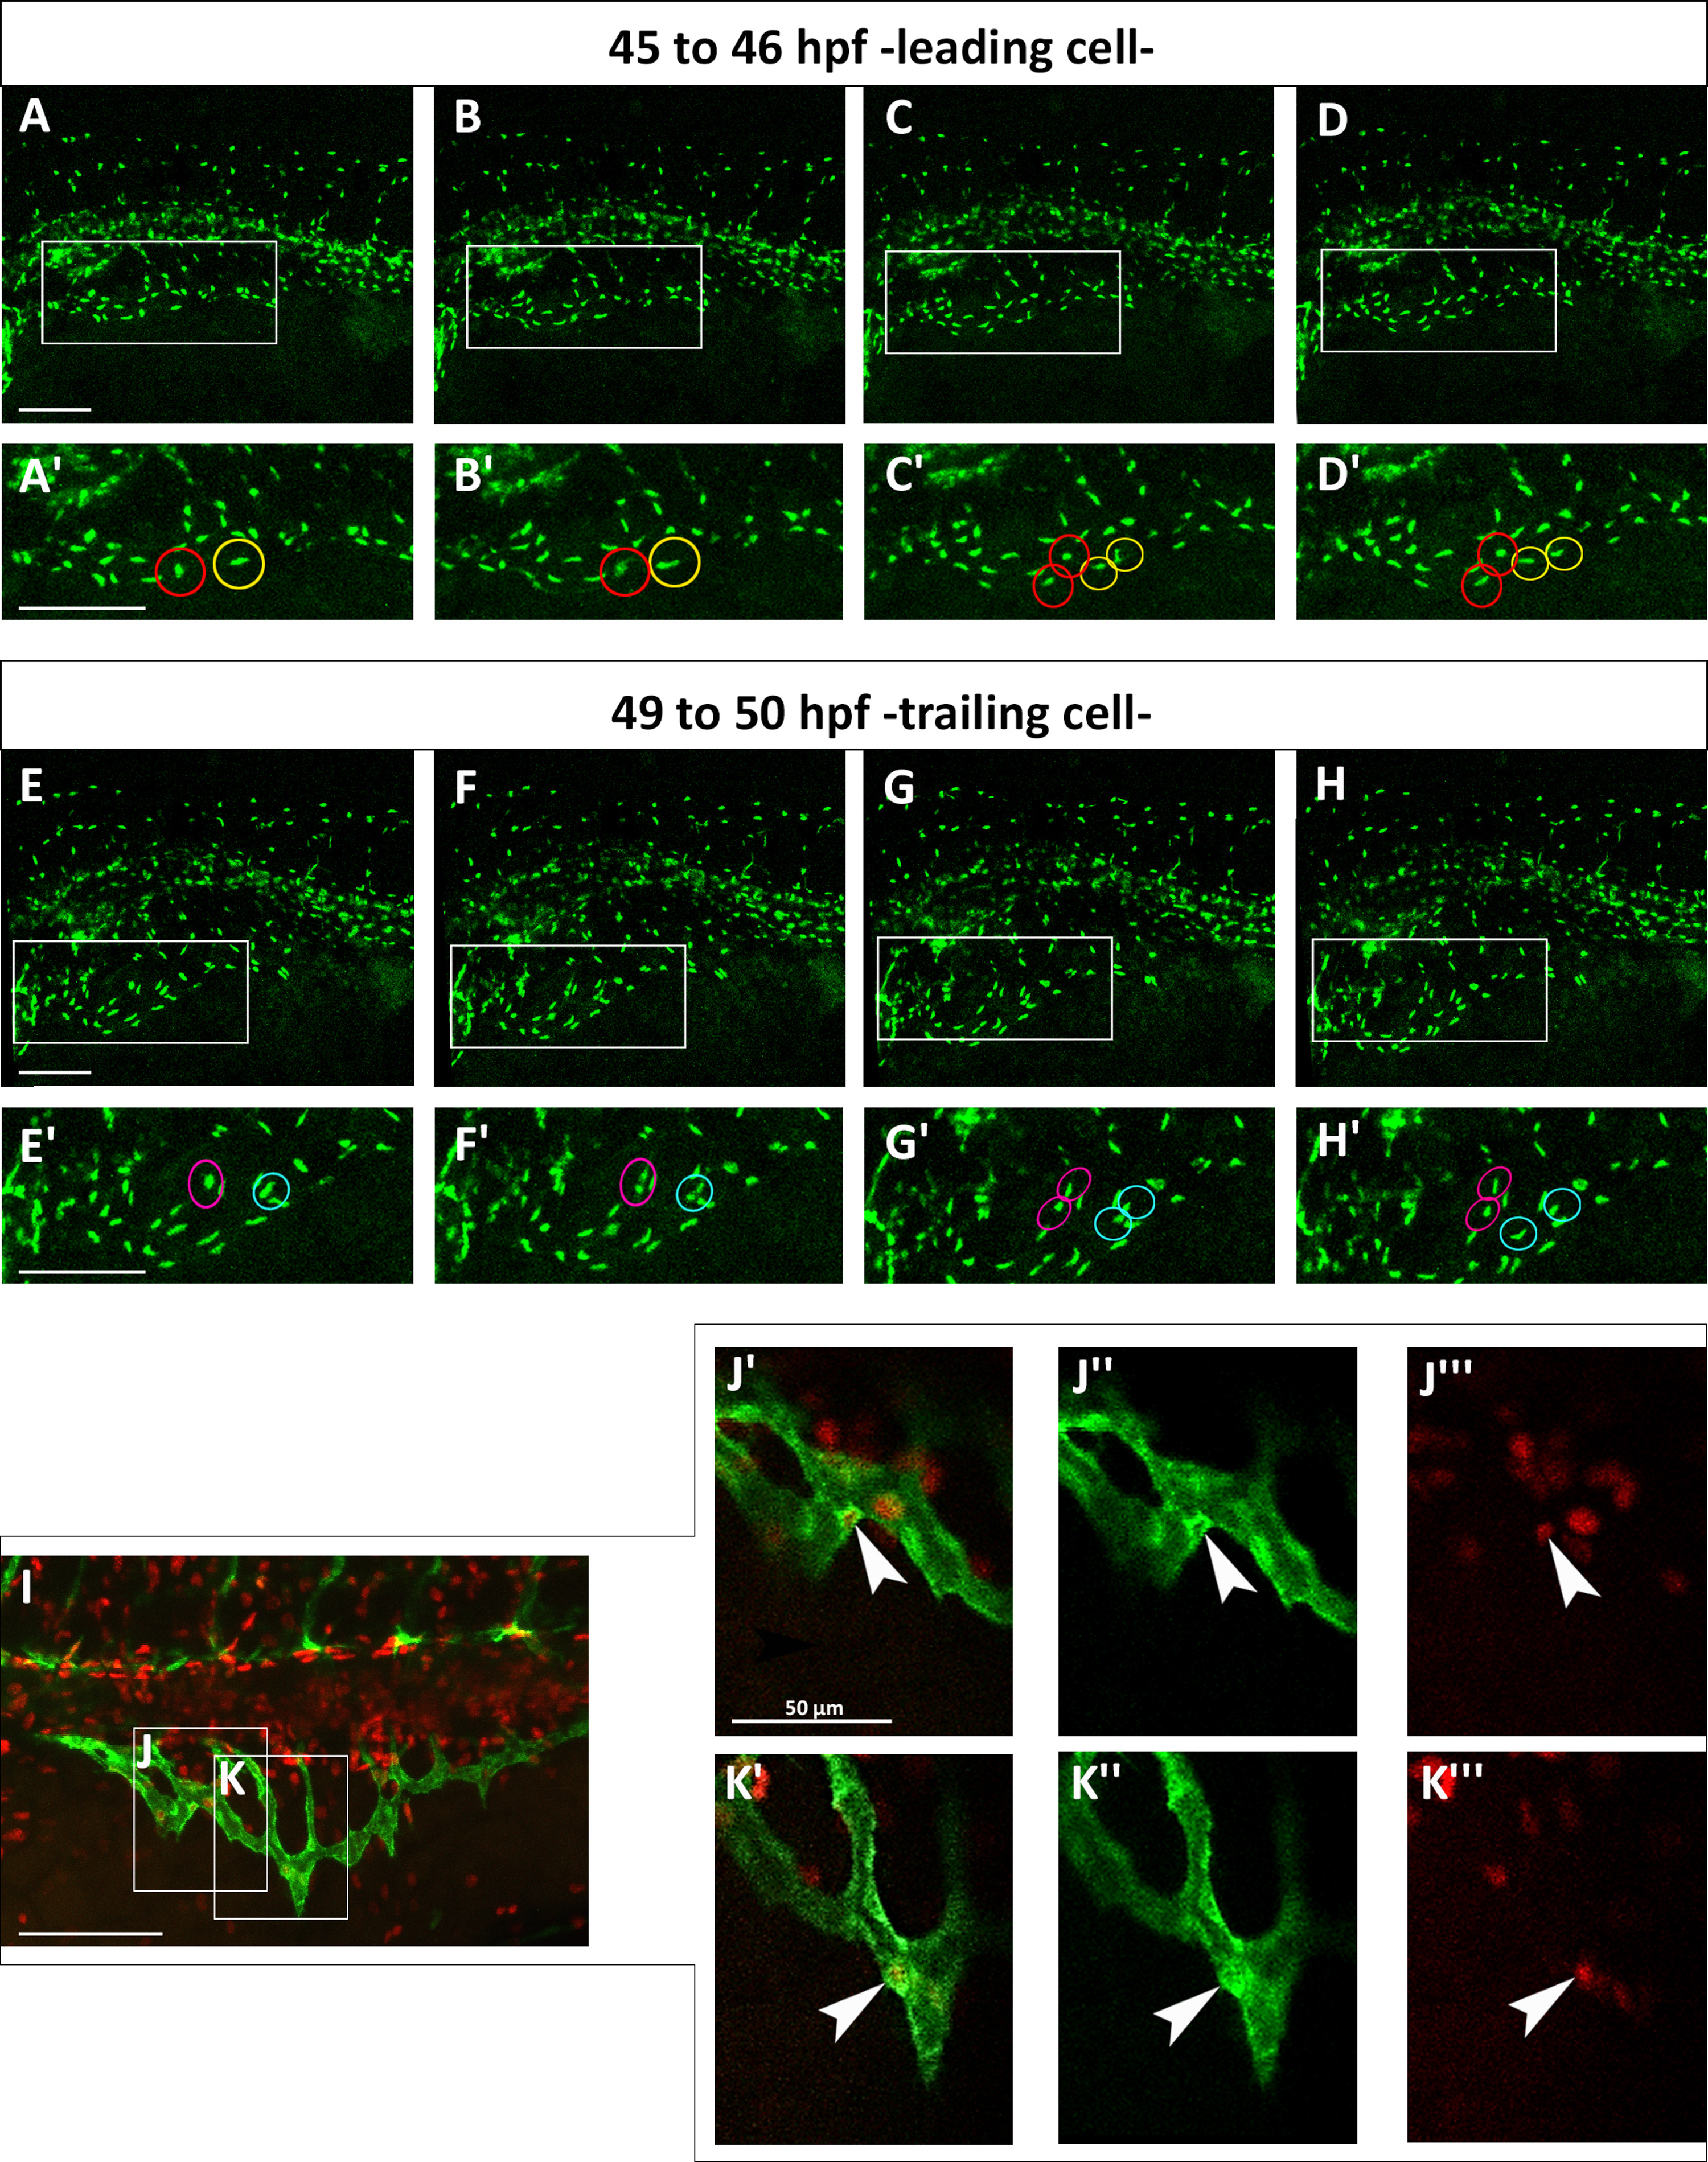
Both leading and trailing cells proliferate during migration. (A–H) Confocal micrographs of a time-lapse of a Tg(fli:EGFP)y7 embryo. (A′–H′) Enlargements are shown below each frame. (A′–D′) Red and yellow circles indicate two proliferating leading cells from about 45 to 46 hpf. (E′–H′) Magenta and blue circles indicate two dividing trailing cells from about 49–50 hpf. (I) Red EdU staining on Tg(fli:EGFP)y1 embryo at 48 hpf. (J–K) Boxes indicate the position of the enlargements from image I. J indicates a trailing cell and K a leading cell. (J′–K′′′) Merge of enlargement of boxes J and K. Endothelial cells are marked green and proliferating nuclei, red. White arrowheads indicate SIVP proliferating cells. Scale bars represent 100 µm.
Reprinted from Developmental Biology, 409(1), Goi, M., Childs, S.J., Patterning Mechanisms of the Sub-Intestinal Venous Plexus in Zebrafish, 114-28, Copyright (2016) with permission from Elsevier. Full text @ Dev. Biol.