
Fig. 3
- ID
- ZDB-IMAGE-160212-2
- Publication
- Abu-Siniyeh et al., 2016 - The aPKC/Par3/Par6 polarity complex and membrane order are functionally inter-dependent in epithelia during vertebrate organogenesis
- All Figures
- Figures for Abu-Siniyeh et al., 2016
|
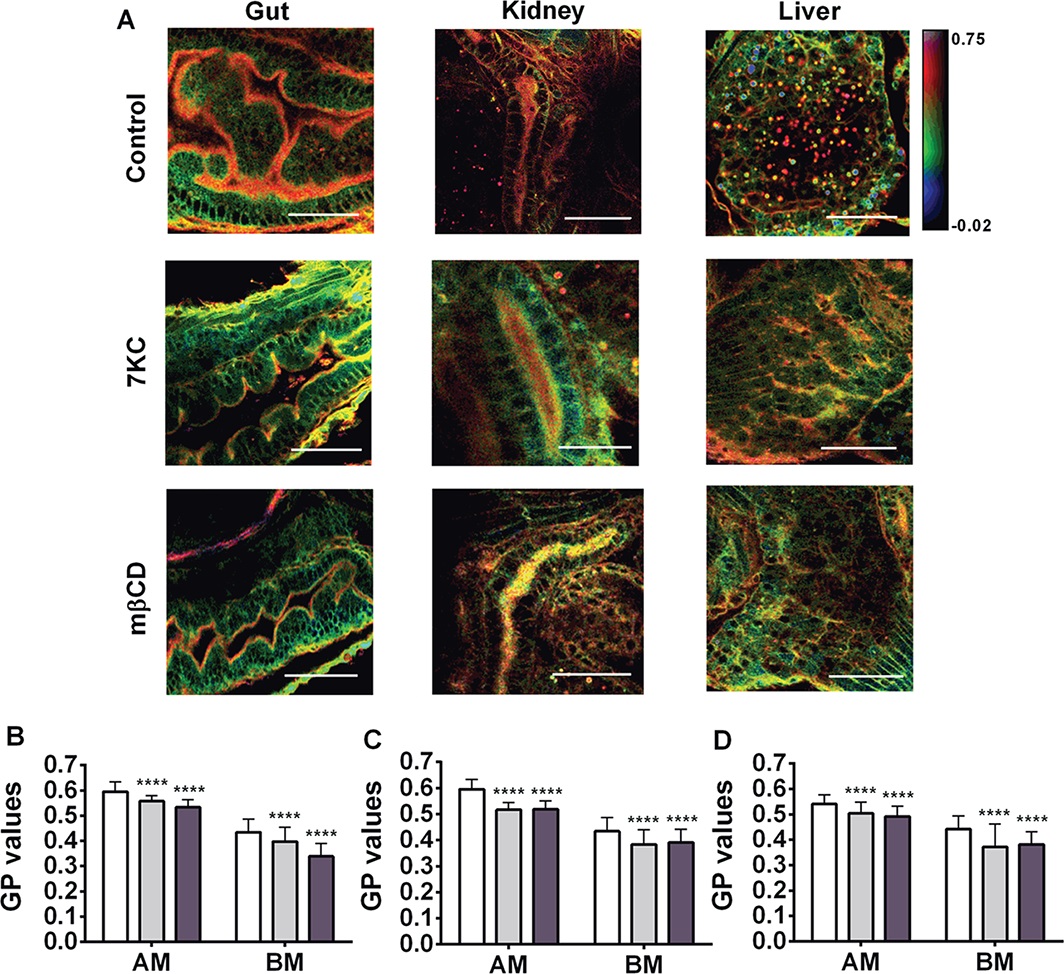
Fig. 3
Membrane order in sterol-manipulated zebrafish larvae. A–D) Six dpf larvae were left untreated (Control; white bars in B–D), enriched in 7KC (100 µm, 30 min; light grey bars in B–D) or depleted of cholesterol with methyl-β-cyclodextrin (mβCD, 2.5 mm, 40 min; dark grey bars in B–D), stained with Laurdan and GP images (A) and GP values (B–D) obtained for epithelial cells in the gut (B), kidney (C) and liver (D) as in Figures 1 and 2. In (A), scale bar = 20 µm. In (B–D), data are mean and standard deviations from 75 regions in 15 larvae corresponding to the apical membranes (AM) and basolateral membranes (BM). ****p < 0.0001 relative to Control (one-way ANOVA with Bonferroni post-test).