
IMAGE
Fig. S3
- ID
- ZDB-IMAGE-160212-12
- Publication
- Abu-Siniyeh et al., 2016 - The aPKC/Par3/Par6 polarity complex and membrane order are functionally inter-dependent in epithelia during vertebrate organogenesis
- All Figures
- Figures for Abu-Siniyeh et al., 2016
Image
|
Figure Caption
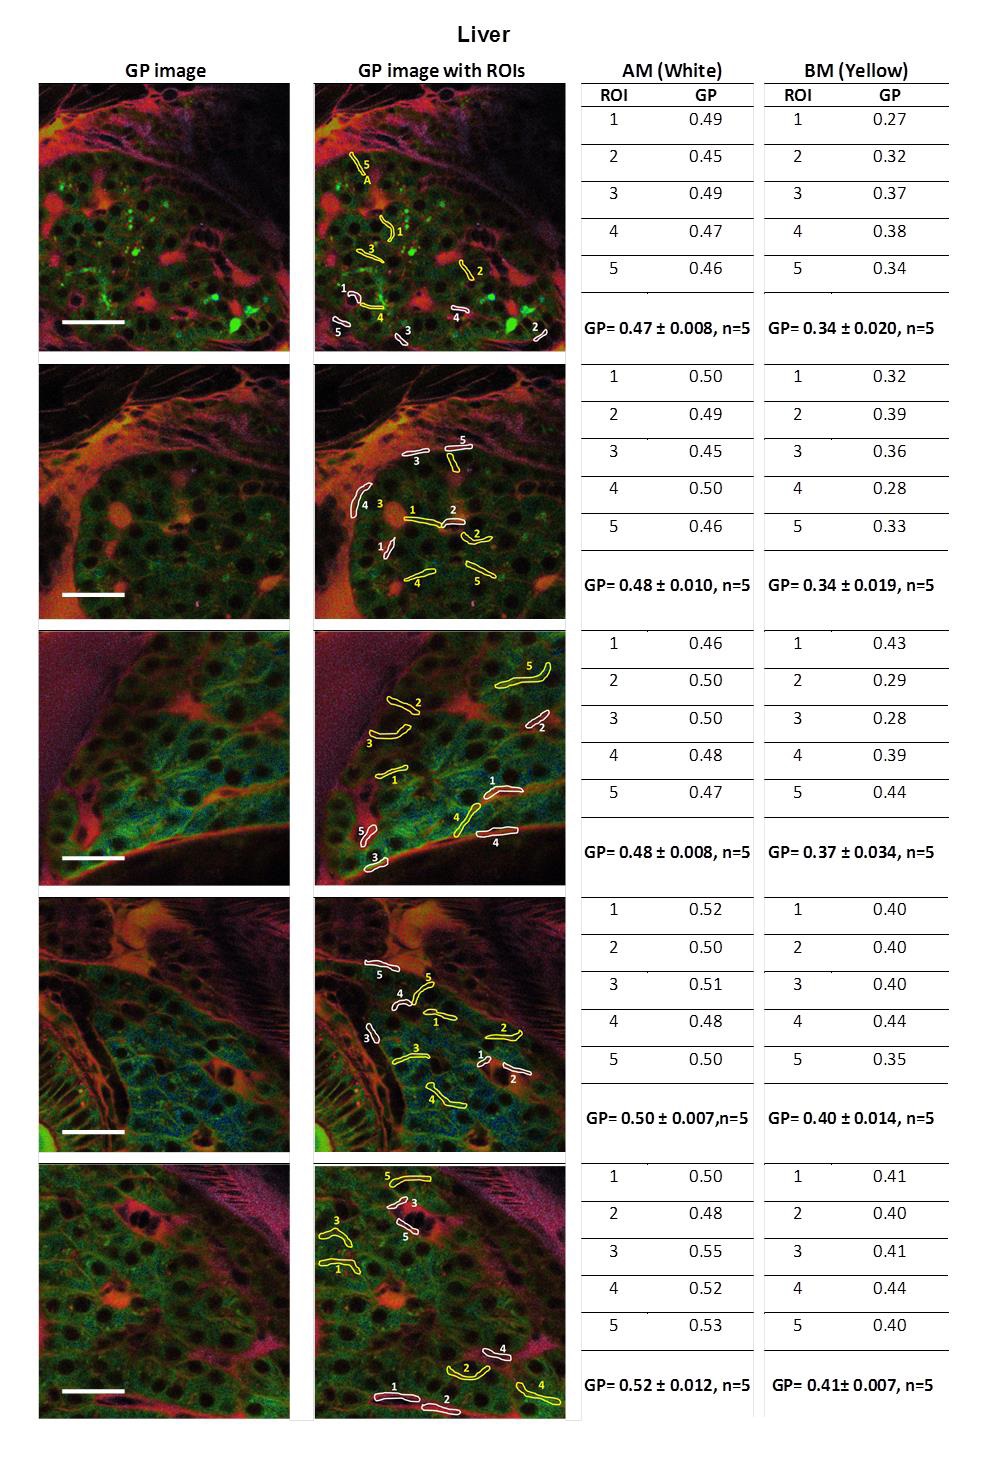
Fig. S3
Figure S3: GP values of AM and BM of the gut, kidney and liver at 4 dpf. GP values were extracted from GP images for five regions in five larvae corresponding to the apical membranes (AM) in white, and basolateral membranes (BM) in yellow of epithelial cells in the gut, kidney and liver. GP values for each region-of-interest (ROI) in AM and BM and mean ± standard deviation of GP values are listed in table next to the images. Scale bar = 20 µm.
Acknowledgments
This image is the copyrighted work of the attributed author or publisher, and
ZFIN has permission only to display this image to its users.
Additional permissions should be obtained from the applicable author or publisher of the image.
Full text @ Traffic