
|
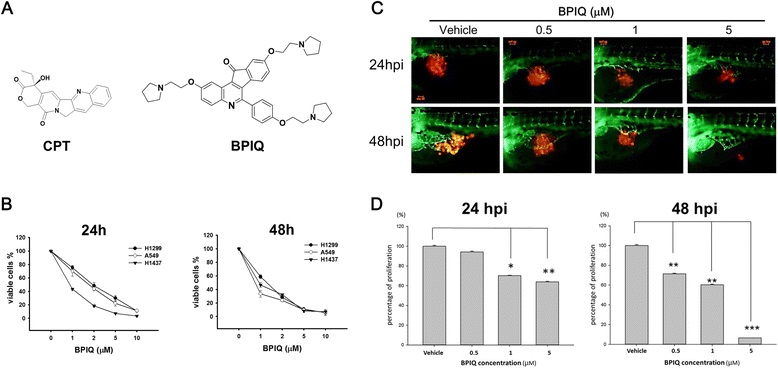
Fig. 1
Effect of BPIQ on proliferation of NSCLC tumor cells. a The structures of CPT and BPIQ. b Three NSCLC H1299, A549 and H1437 cells were incubated with various concentrations of BPIQ for 24 and 48 h, respectively. The percentage of viable cells was calculated as a ratio of BPIQ- to DMSO-treated control cells. c The tumor volume in the zebrafish xenograft model. The intensity of red fluorescence is proportional to the xenograft tumor size. N = 20 embryos for each group. d The quantificative analysis of c. All data are presented as mean ± S.D. of three independent experiments. (*p < 0.05, **p < 0.005 and ***p < 0.001 against vehicle control, respectively)