
|
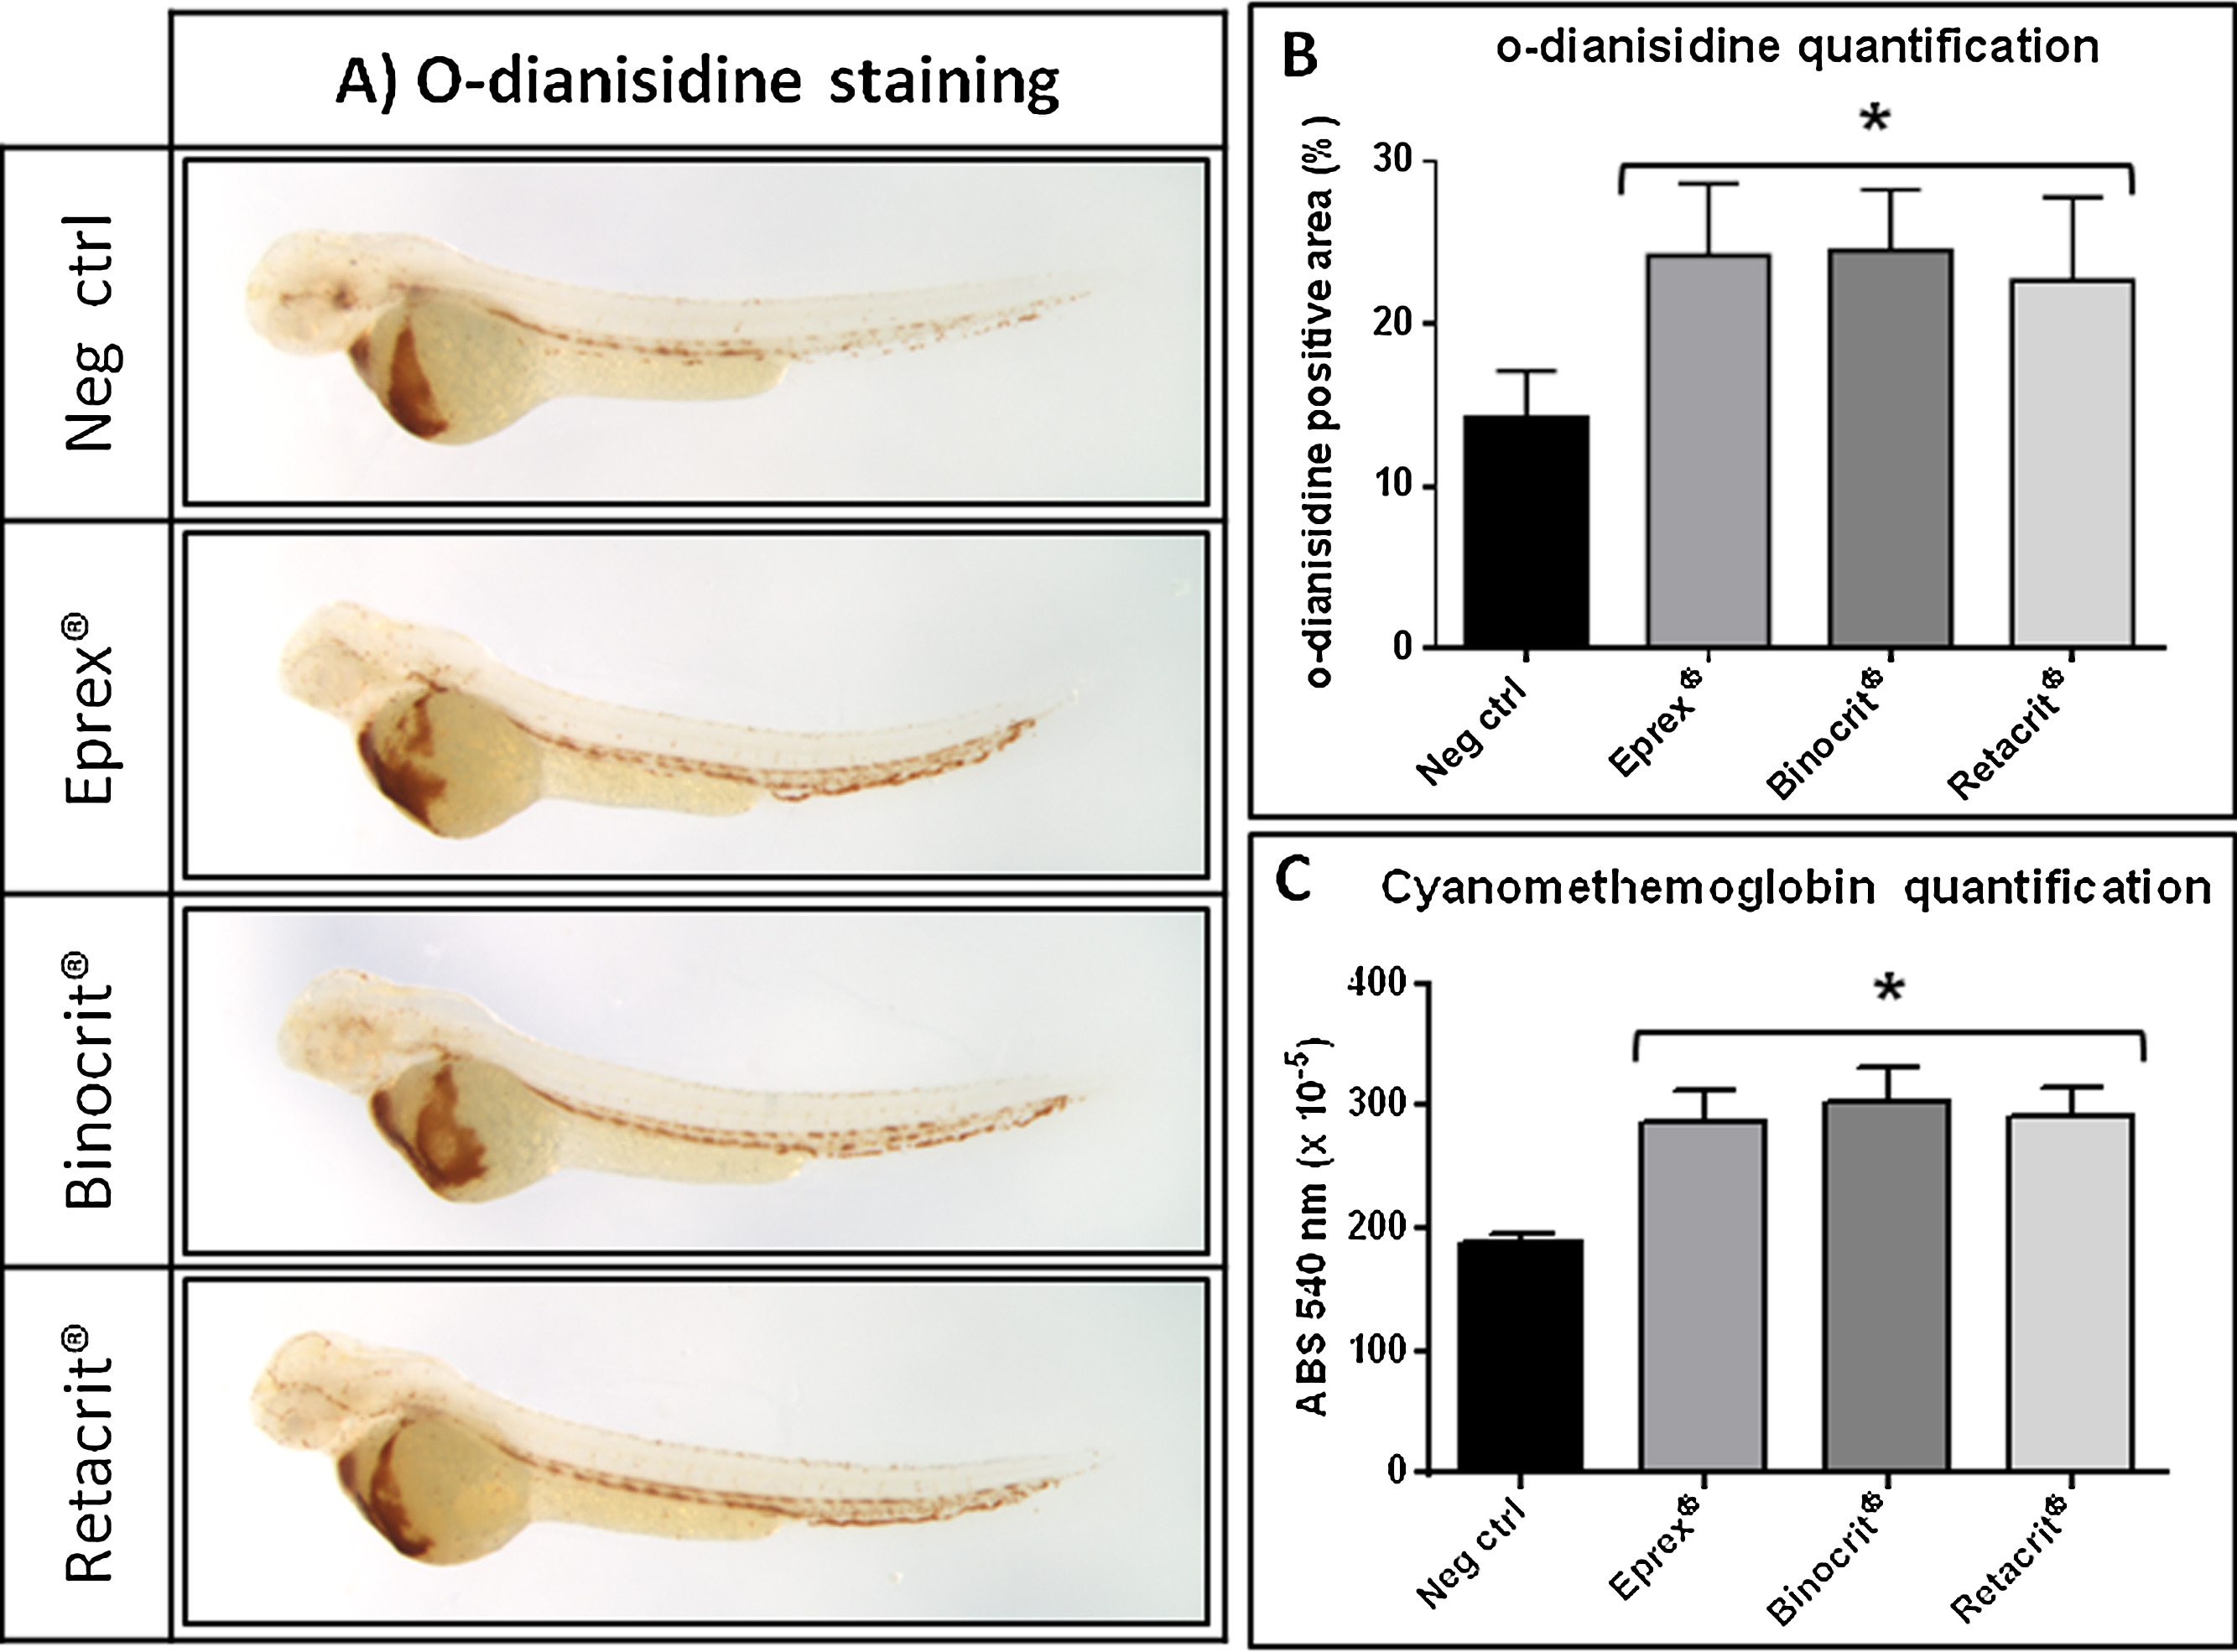
Fig. 5
O-dianisidine staining and Drabkin assay quantification of 48 hpf wild type AB embryos injected with negative control (Neg ctrl), Eprex®, Binocrit® or Retacrit®. (A) Representative images of embryos stained with o-dianisidine 4 h after treatment. Lateral views, anterior to the left, 4X magnification; (B) quantification of o-dianisidine positive area in the region of trunk and tail, measured with ImageJ 1.45 s image analysis software on a mean of 25 embryos for each experimental point. Asterisk indicates statistically significant increase of the positive area (p < 0.05), data are the mean ± S.D. of 3 measurements; (C) cyanomethemoglobin absorbance measured at 540 nm, proportional to the amount of red blood cells in groups of 20 embryos. Asterisk indicates statistically significant increase of absorbance (p < 0.05), data are the mean ± S.D. of 3 measurements.