
Fig. 5
- ID
- ZDB-IMAGE-160205-87
- Publication
- Chang et al., 2016 - Zebrafish cerebrospinal fluid mediates cell survival through a retinoid signaling pathway
- All Figures
- Figures for Chang et al., 2016
|
Fig. 5
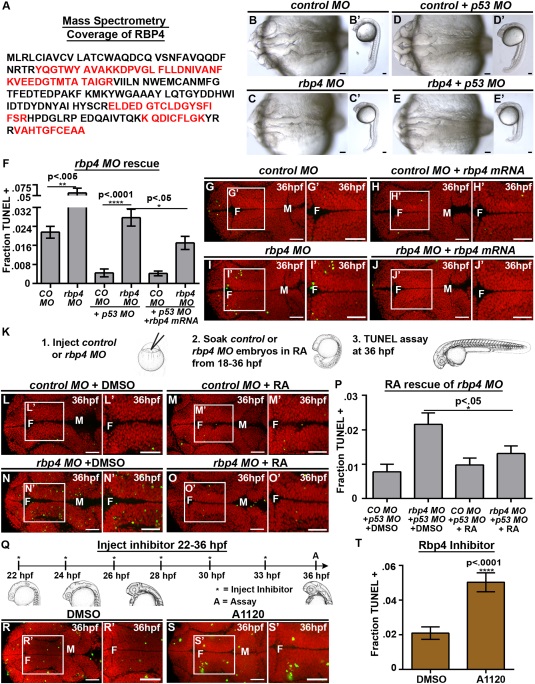
Loss of Rbp4 increases cell death. (A) Rbp4 sequence coverage from mass spectrometry (red). (B–E) Brightfield dorsal and lateral (B2–E2) view of control MO (B), control MO + p53 MO (C), rbp4 MO (D) and rbp4 MO + p53 MO (E) embryos. (F) Quantification of TUNEL after rbp4 MO and mRNA rescue. (G–J, L–O, R–S) Dorsal view of TUNEL (green) and propidium iodide (red). (G–J) TUNEL staining in control MO + p53 MO (G), control MO + rbp4 mRNA+ p53 MO (H), rbp4 MO+ p53 MO (I), rbp4 MO + rbp4 mRNA + p53 MO (J). (K) Method for RA rescue of rbp4 MO. (L–O) TUNEL staining in control MO + p53 MO + DMSO (L) control MO + p53 MO + RA (M), rbp4 MO+ p53 MO + DMSO (N), rbp4 MO + p53 MO + RA (O). (P) Quantification of TUNEL in RA rescue of rbp4 MO. (Q) Method of injection of Rbp4 inhibitor, A1120. (R-S) TUNEL staining in DMSO (R) or A1120 (S) injected embryos (T) Quantification of TUNEL in A1120 or DMSO injected embryos. Data represented as mean ± SEM. F = forebrain, M = midbrain, H = hindbrain. Scale bars = 50 µm.