
|
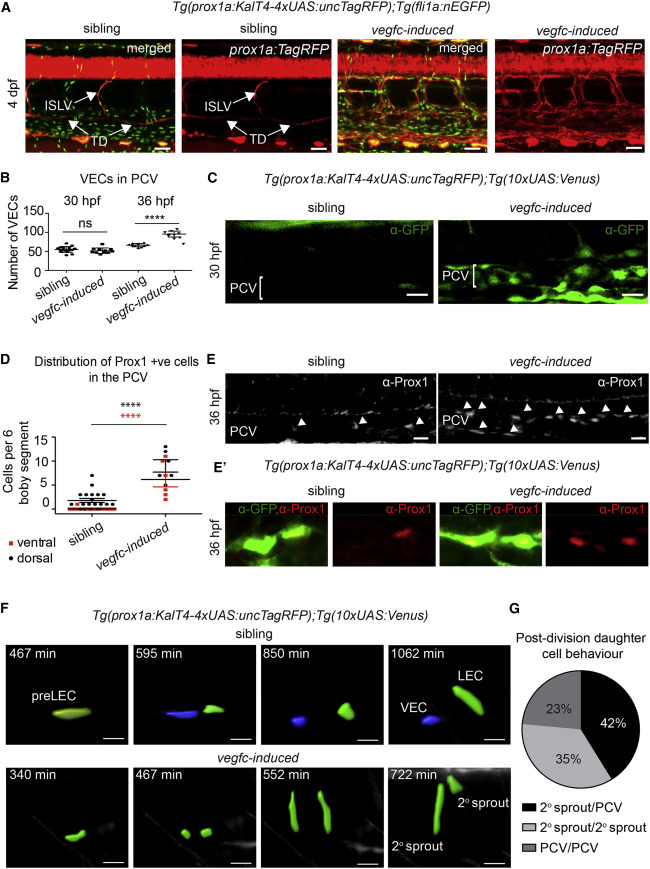
Fig. 6
Vegfc Is Sufficient to Induce Prox1 Expression and Regulate Daughter Cell Behaviors
(A) Maximum intensity projections of Tg(fli1a:nEGFP) in green and prox1a:TagRFP in red, with Tg(10xUAS:vegfc) (n = 8, vegfc-induced) and sibling (n = 8) embryos at 4 dpf. ISLV, intersegmental lymphatic vessels; TD, thoracic duct. Scale bar, 40 µm.
(B) Quantification of VEC number at 30 and 36 hpf using Tg(fli1a:nEGFP) in sibling (30 hpf, n = 16; 36 hpf, n = 10 embryos) and vegfc-induced embryos (30 hpf, n = 11; 36 hpf, n = 10 embryos) (ANOVA p < 0.0001; mean [SD]).
(C) Confocal projections of prox1a:Venus expression in the posterior cardinal vein (PCV) in sibling (n = 2) and vegfc-induced (n = 8) embryos at 30 hpf. Scale bar, 20 µm.
(D) Number of Prox1-positive (antibody staining) cells in dorsal or ventral PCV in sibling (n = 20) and vegfc-induced (n = 6) embryos scored across six somites at 36 hpf. vegfc-induced embryos showed a 5-fold increase in dorsal wall cells and further increase in ventral wall cells (mean ± SEM).
(E) Confocal projections of endogenous Prox1 expressing cells (gray) in vegfc-induced (n = 10) and sibling embryos (n = 18) (scale bar, 20 µm) at 36 hpf.
(E′) Confocal projections of prox1a:Venus-expressing cells co-stained with endogenous Prox1. In vegfc-induced (n = 11) embryos, Prox1 was present in all prox1a:Venus-positive cells compared with control cells (n = 8).
(F) Confocal projections from time lapse of sibling (top) and vegfc-induced (bottom) embryos showing rendered prox1a:Venus cells (pre-LEC, yellow; VEC, blue; LEC, green. Scale bar, 20 µm.
(G) Quantification of daughter cell behaviors from prox1a-positive precursors in vegfc-induced embryos visualized in time lapse from 30 hpf. In 42%, one cell migrated dorsally (2° sprout) and one remained in the PCV; in 35%, both daughter cells migrated dorsally; and in 23%, both cells remained in the PCV (from n = 17 cell divisions scored in n = 10 movies).