
|
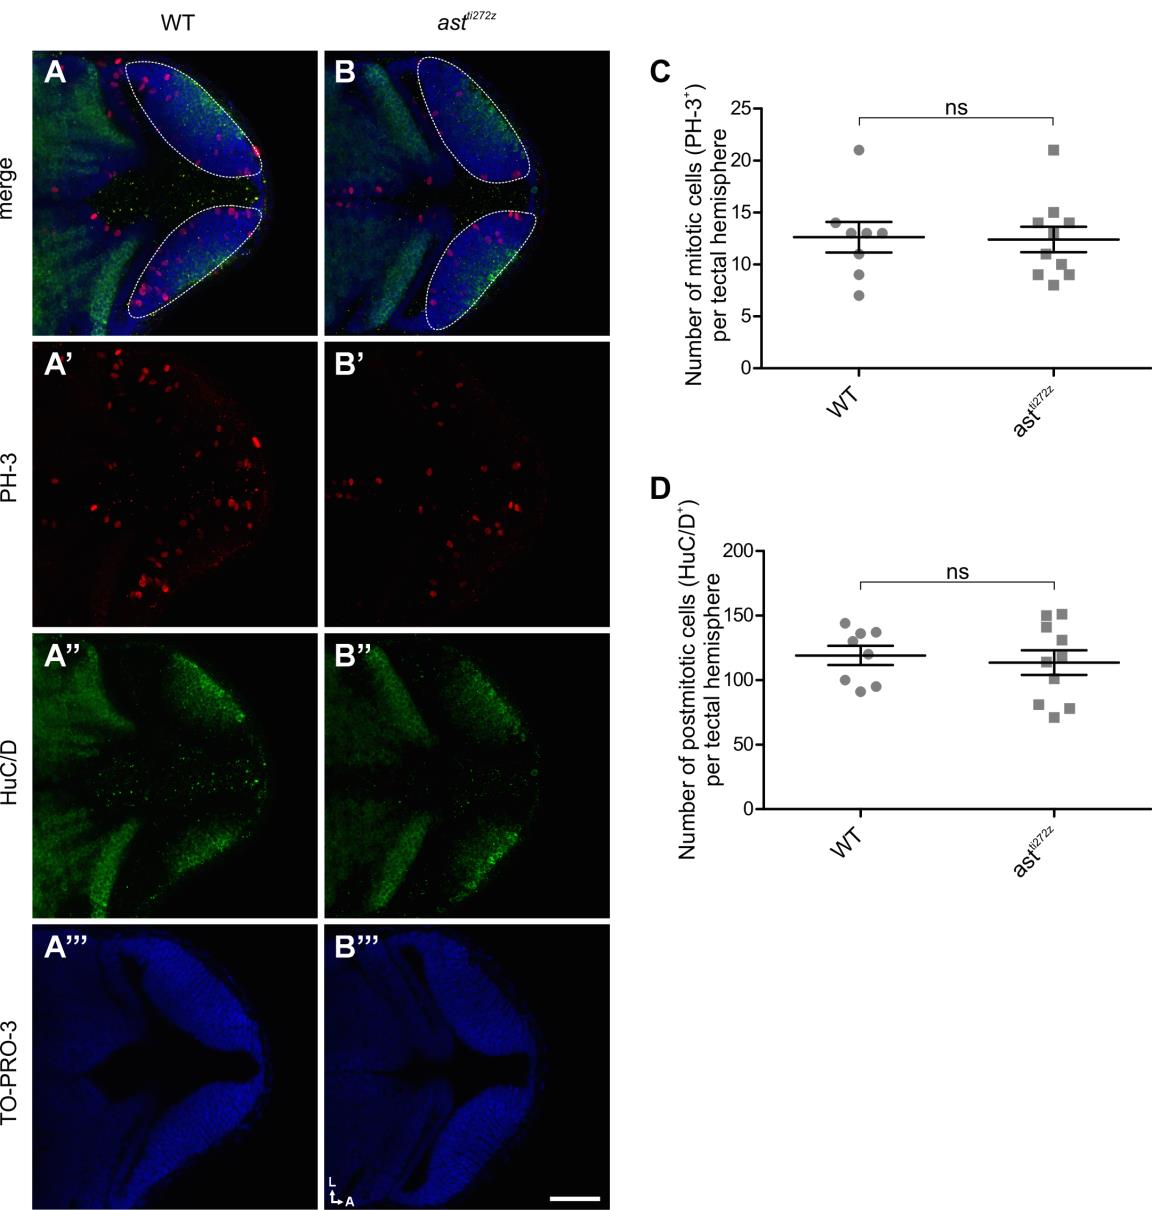
Fig. S5
Tectal proliferation and differentiation are unaffected in astray mutants (related to Figure 3). Measurement of proliferation and differentiation in WT (n = 4) and astti272z (n = 5) larvae at 48 hpf. (A-B) Single confocal sections showing dorsal views of WT (A) and astti272z (B) embryos immunostained for PH-3 and HuC/D to mark mitotic and postmitotic cells, respectively. TO-PRO-3 was also used to stain cell nuclei. Dashed line outlines the border of each tectal hemisphere. Scale bar represents 50 µm. A, anterior; L, lateral. (C-D) Quantification of the degree of proliferation and differentiation in the tectum. For the number of mitotic cells (PH-3+) (C) 12.6 ± 1.4 for WT and 12.4 ± 1.2 for astti272z; for the number of post-mitotic cells (HuC/D+) (D) 119.1 ± 7.4 for WT and 113.6 ± 9.4 for astti272z. All graphs show mean values ± SEM. ns, not significant, unpaired t-test.