
|
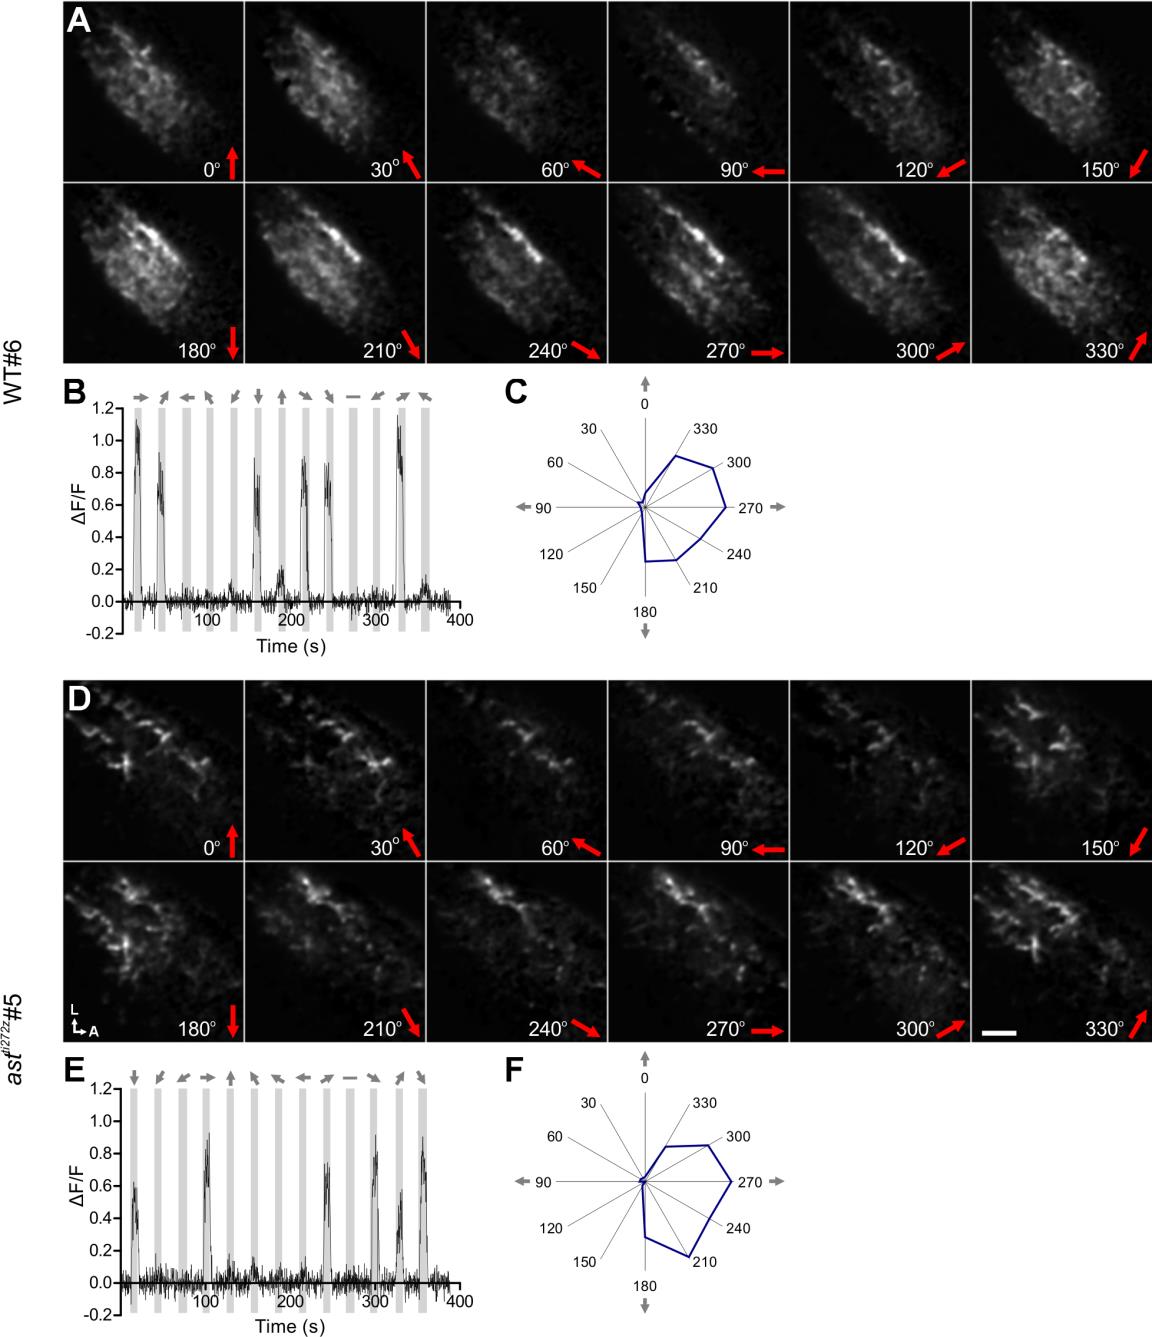
Fig. S1
Responses of SyGCaMP3-expressing RGC axons terminating in the optic tectum (related to Figure 1). Examples of tuning experiments from WT (A-C) and astti272z (D-F) Tg(Isl2b:Gal4;UAS:SyGCaMP3) larvae at 7 dpf are shown. (A, D) Montages showing integral responses (grayscale) of all RGC axons in the tectum. Direction of motion is shown on the bottom right in each panel. Scale bar represents 20 µm. A, anterior; L, lateral. (B, E) Representative response of single voxels during a tuning experiment. Stimulus epochs are shown in gray and direction of motion is indicated by arrows on the top. (C, F) Integral responses from (B) and (E) are shown in polar plot form.