
IMAGE
Fig. S5
- ID
- ZDB-IMAGE-151228-22
- Publication
- Mendieta-Serrano et al., 2015 - Spatial and temporal expression of zebrafish glutathione peroxidase 4 a and b genes during early embryo development
- All Figures
- Figures for Mendieta-Serrano et al., 2015
Image
|
Figure Caption
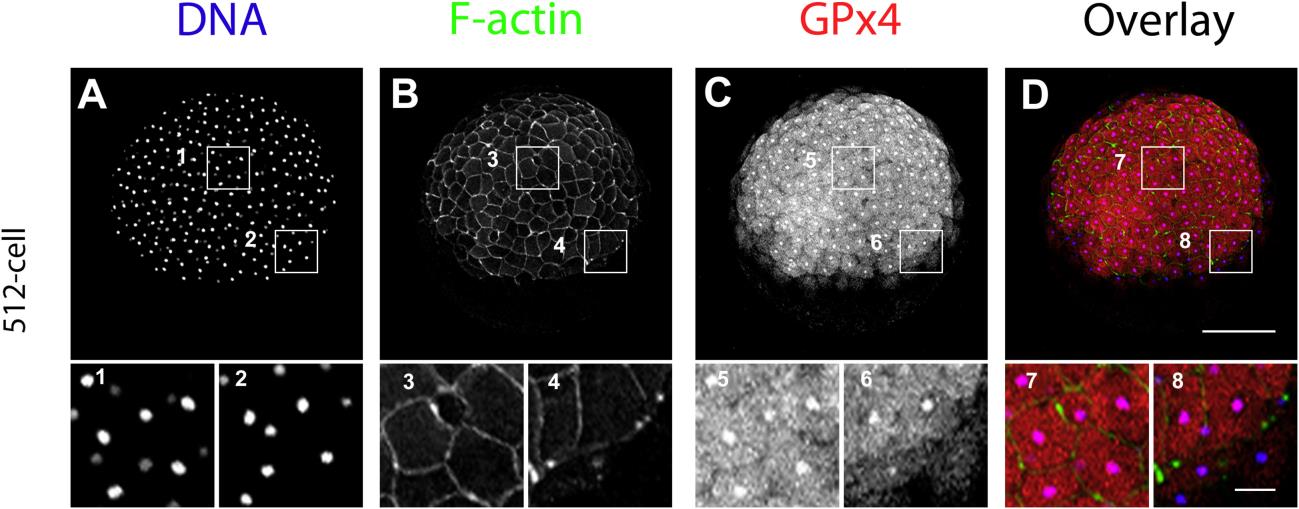
Fig. S5 GPx4 localization patterns in zebrafish embryos at the 512-cell stage. Notice how the GPx4 nuclei localization is observed in all blastomeres at this stage (C). Overlay, superimposition of DNA (in blue), F-actin (in green) and GPx4 (in red). Animal pole views are shown. A-D, scale bar 200 µm, insets 50 µm.
Acknowledgments
This image is the copyrighted work of the attributed author or publisher, and
ZFIN has permission only to display this image to its users.
Additional permissions should be obtained from the applicable author or publisher of the image.
Reprinted from Gene expression patterns : GEP, 19(1-2), Mendieta-Serrano, M.A., Schnabel-Peraza, D., Lomelí, H., Salas-Vidal, E., Spatial and temporal expression of zebrafish glutathione peroxidase 4 a and b genes during early embryo development, 98-107, Copyright (2015) with permission from Elsevier. Full text @ Gene Expr. Patterns