
Fig. 3
- ID
- ZDB-IMAGE-151228-13
- Antibodies
- Publication
- Mendieta-Serrano et al., 2015 - Spatial and temporal expression of zebrafish glutathione peroxidase 4 a and b genes during early embryo development
- All Figures
- Figures for Mendieta-Serrano et al., 2015
|
Fig. 3
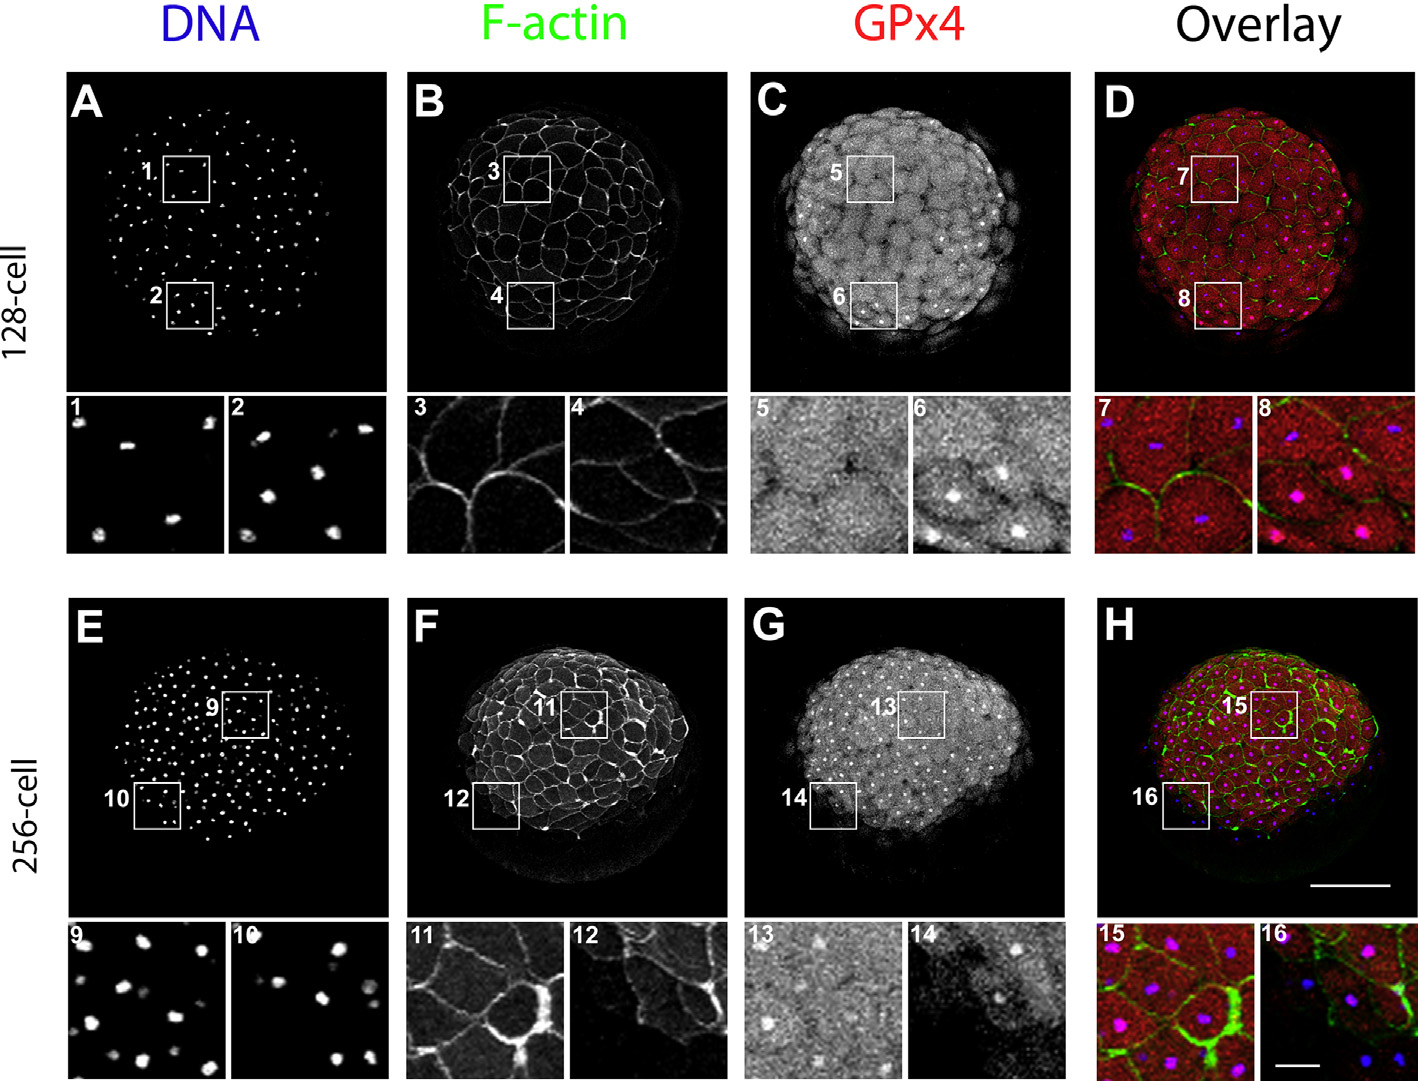
GPx4 immunofluorescence localization patterns in 128- and 256-cell zebrafish embryos as detected by laser confocal microscopy. 128-cell embryo (A, B, C and D). 1, 2, 3, 4, 5, 6, 7 and 8 show amplifications of two different regions to highlight a cluster of cells that start showing GPx4 in the nuclei (6 and 8). 256-cell stage embryo (E, F, G and H). 9, 10, 11, 12, 13, 14, 15 and 16 are amplifications of two different regions that indicate the nuclear localization of GPx4. DNA, Hoechst-stained embryos (A and E). F-actin, phalloidin Alexa 488-stained embryos (B and F). GPx4, immunolocalization in whole embryos (C and G). Animal pole views are shown. A-H, scale bar 200 µm, insets 50 µm.
Reprinted from Gene expression patterns : GEP, 19(1-2), Mendieta-Serrano, M.A., Schnabel-Peraza, D., Lomelí, H., Salas-Vidal, E., Spatial and temporal expression of zebrafish glutathione peroxidase 4 a and b genes during early embryo development, 98-107, Copyright (2015) with permission from Elsevier. Full text @ Gene Expr. Patterns