
|
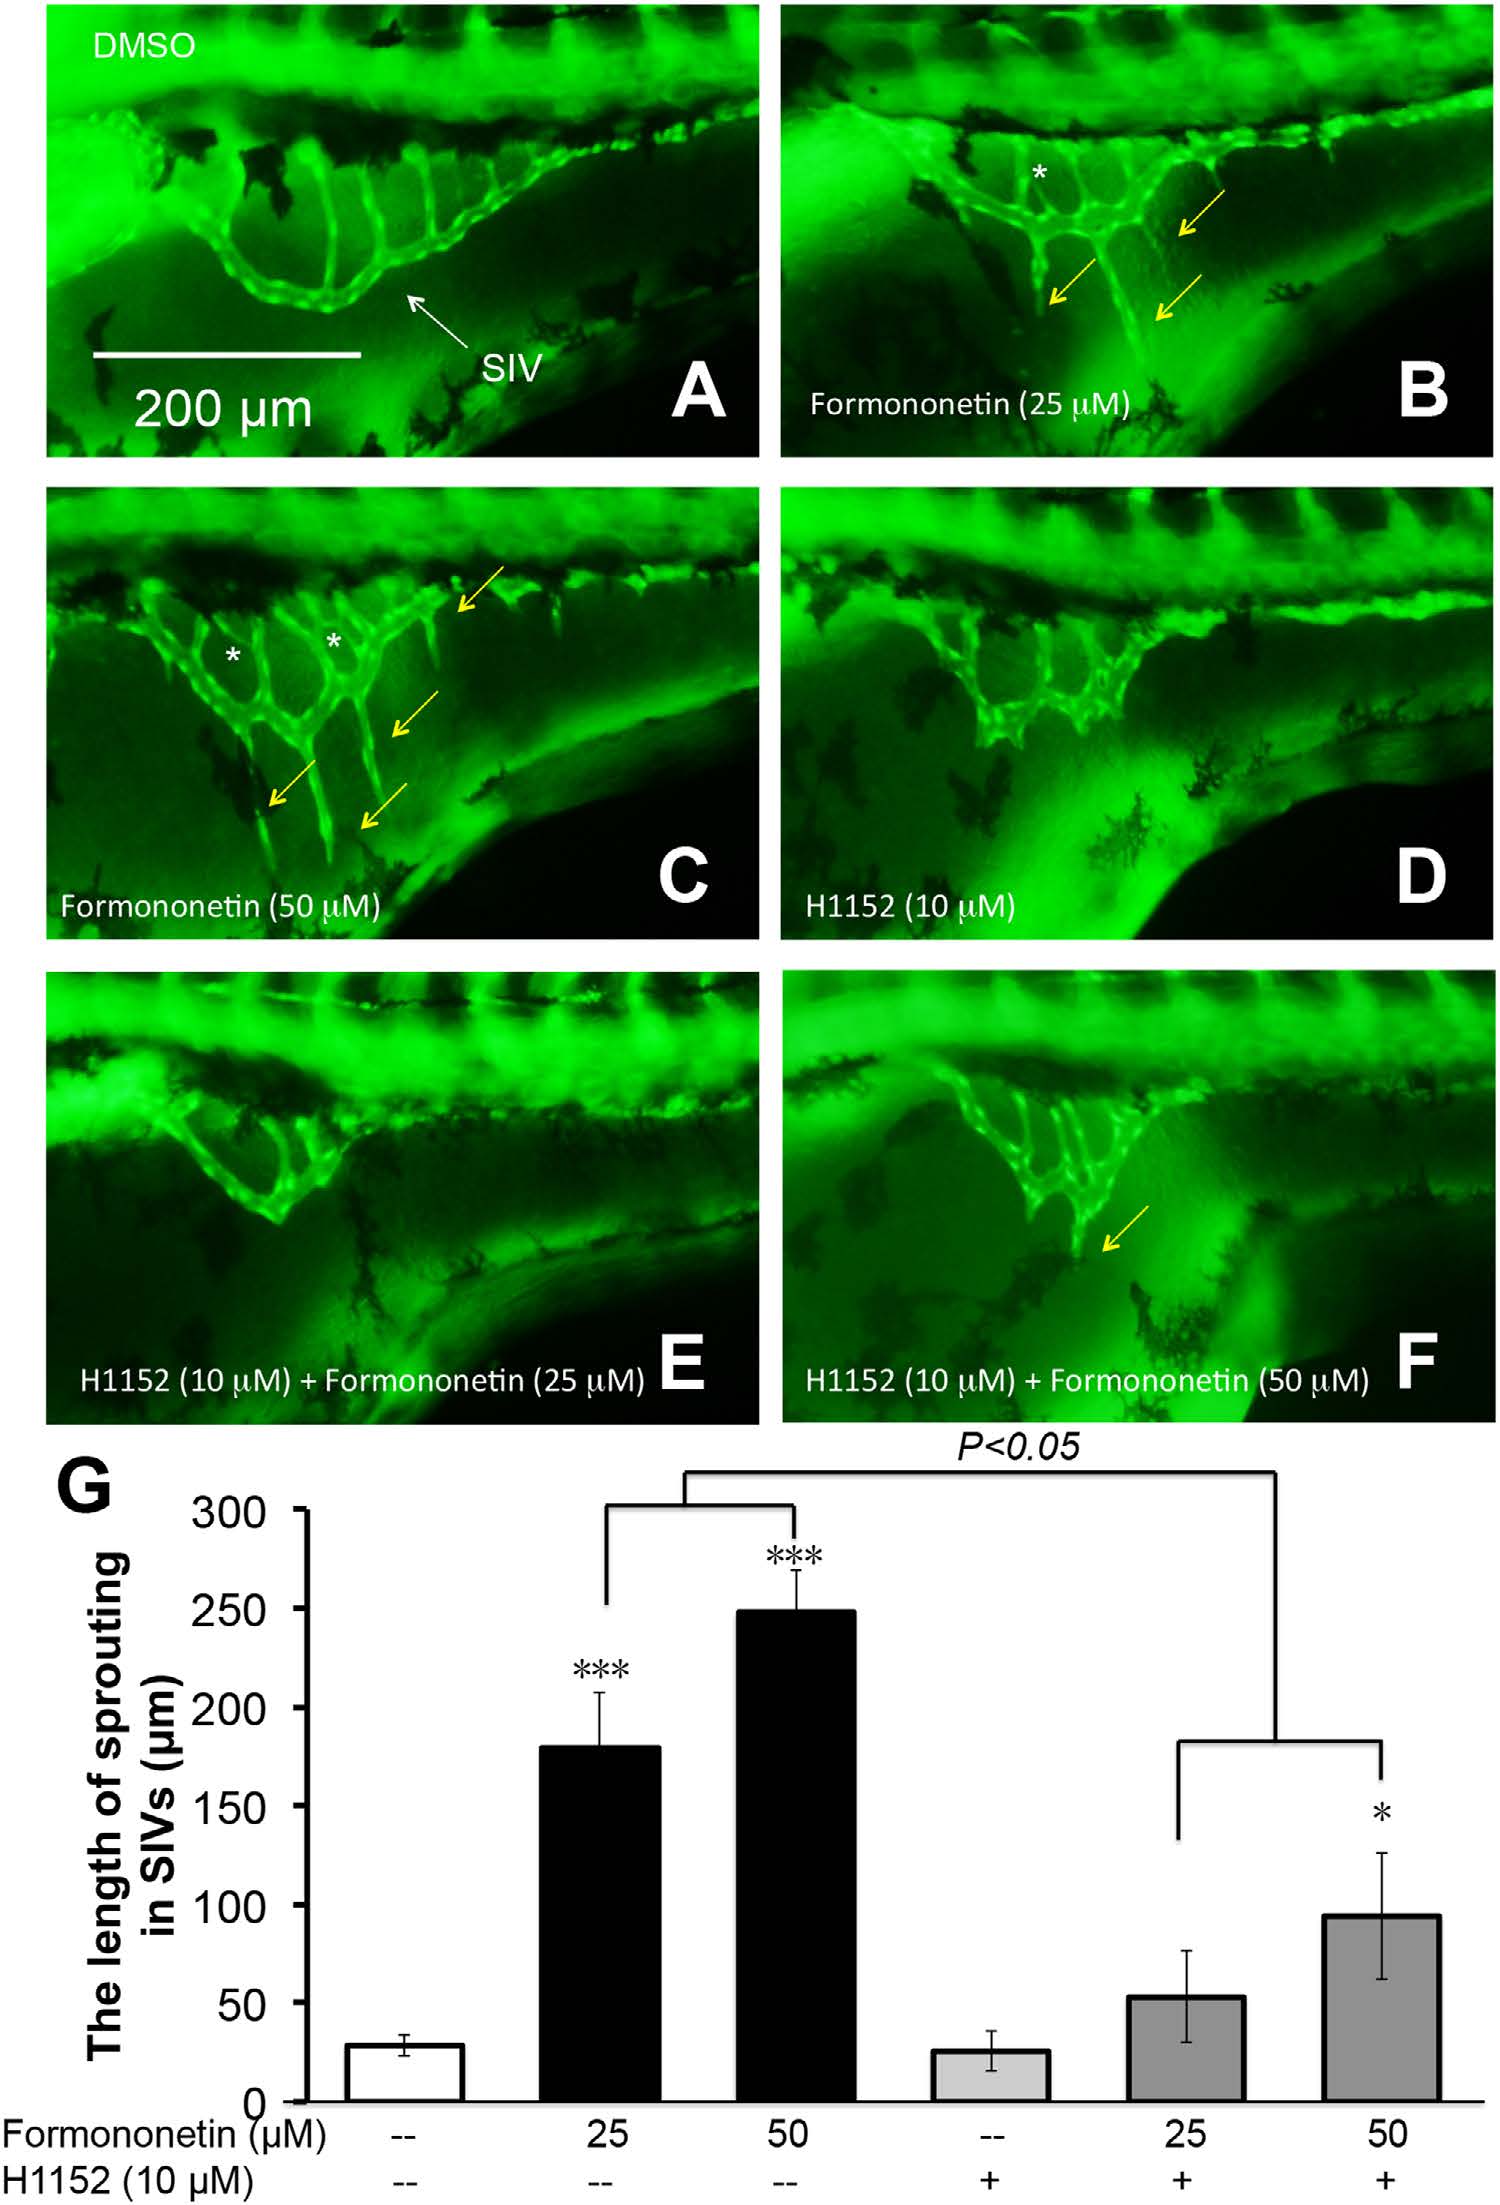
Fig. 12 The effects of ROCK inhibitor in formononetin-induced angiogenesis in zebrafish embryos in vivo.
Tg (fli1: EGFP)y1 zebrafish embryos (48 hpf) were treated with (A) 0.1% DMSO (negative control), (B) formononetin (25 µM), (C) formononetin (50 µM), (D) H1152 (10 µM, ROCK inhibitor) alone, (E) co-treatment of H1152 (10 µM) +formononetin (25 µM), (F) co-treatment of H1152 (10 µM) +formononetin (50 µM). All treatments were for 24 h. (G) Quantitative analysis indicated the length of sprouting in SIVs for each group. Data are plotted as means ± SD, from three individual experiments. *p < 0.05, ***p < 0.001 vs. control group.