
IMAGE
Fig. S4
- ID
- ZDB-IMAGE-151214-58
- Publication
- Takeuchi et al., 2015 - LSD1/KDM1A promotes hematopoietic commitment of hemangioblasts through downregulation of Etv2
- All Figures
- Figures for Takeuchi et al., 2015
Image
|
Figure Caption
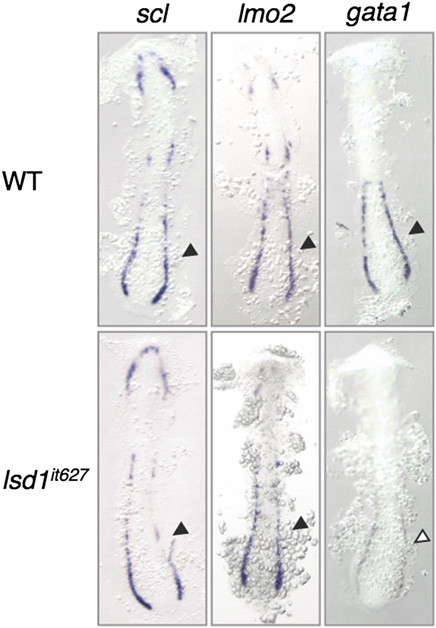
Fig. S4
Expression of scl and lmo2 in lsd1it627 embryos. The expression of scl, lmo2, and gata1 at 15 hpf in WT or lsd1it627 embryos is shown. Arrowheads indicate the posterior LPM.
Acknowledgments
This image is the copyrighted work of the attributed author or publisher, and
ZFIN has permission only to display this image to its users.
Additional permissions should be obtained from the applicable author or publisher of the image.
Full text @ Proc. Natl. Acad. Sci. USA