
Fig. S2
- ID
- ZDB-IMAGE-151214-50
- Genes
- Publication
- Roxo-Rosa et al., 2015 - The zebrafish Kupffer's vesicle as a model system for the molecular mechanisms by which the lack of Polycystin-2 leads to stimulation of CFTR
- All Figures
- Figures for Roxo-Rosa et al., 2015
|
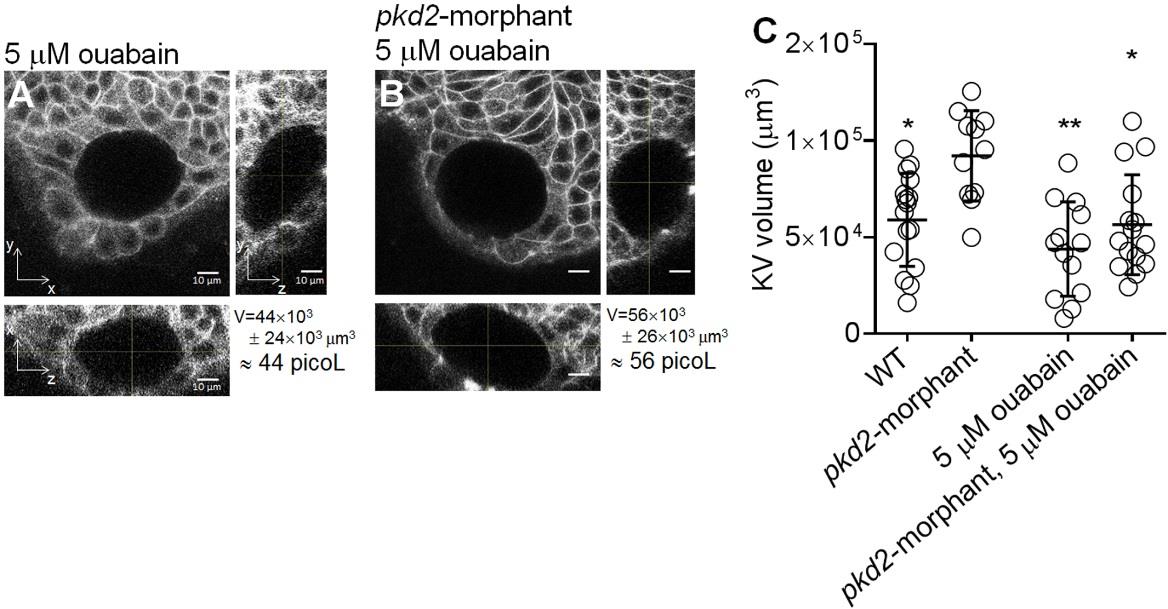
Fig. S2 Ouabain effect on KV volume. Live-scans of the whole KV of 10–11 s.s. ras:GFP transgenic embryos. The middle focal plan along the XY axis and the respective orthogonal views (along XZ and YZ axes) are shown for the most representative 5 µM ouabain treated WT (A) and pkd2-morphant (B) embryos. KVvolume is indicated in µm3 and in picoL. Scale bars: 10 µm. (C) Estimated KV volume (µm3) for WT (n = 16), pkd2-mismatch MO (n = 12), 5 µM ouabain treated WT (n = 13) and pkd2-morphant (n = 15) embryos. Average values and the respective s.d. are indicated. * and **, significantly different from pkd2-morphants (p < 0.05 and p < 0.0001, respectively).