
Fig. 2
- ID
- ZDB-IMAGE-151214-48
- Genes
- Publication
- Roxo-Rosa et al., 2015 - The zebrafish Kupffer's vesicle as a model system for the molecular mechanisms by which the lack of Polycystin-2 leads to stimulation of CFTR
- All Figures
- Figures for Roxo-Rosa et al., 2015
|
Fig. 2
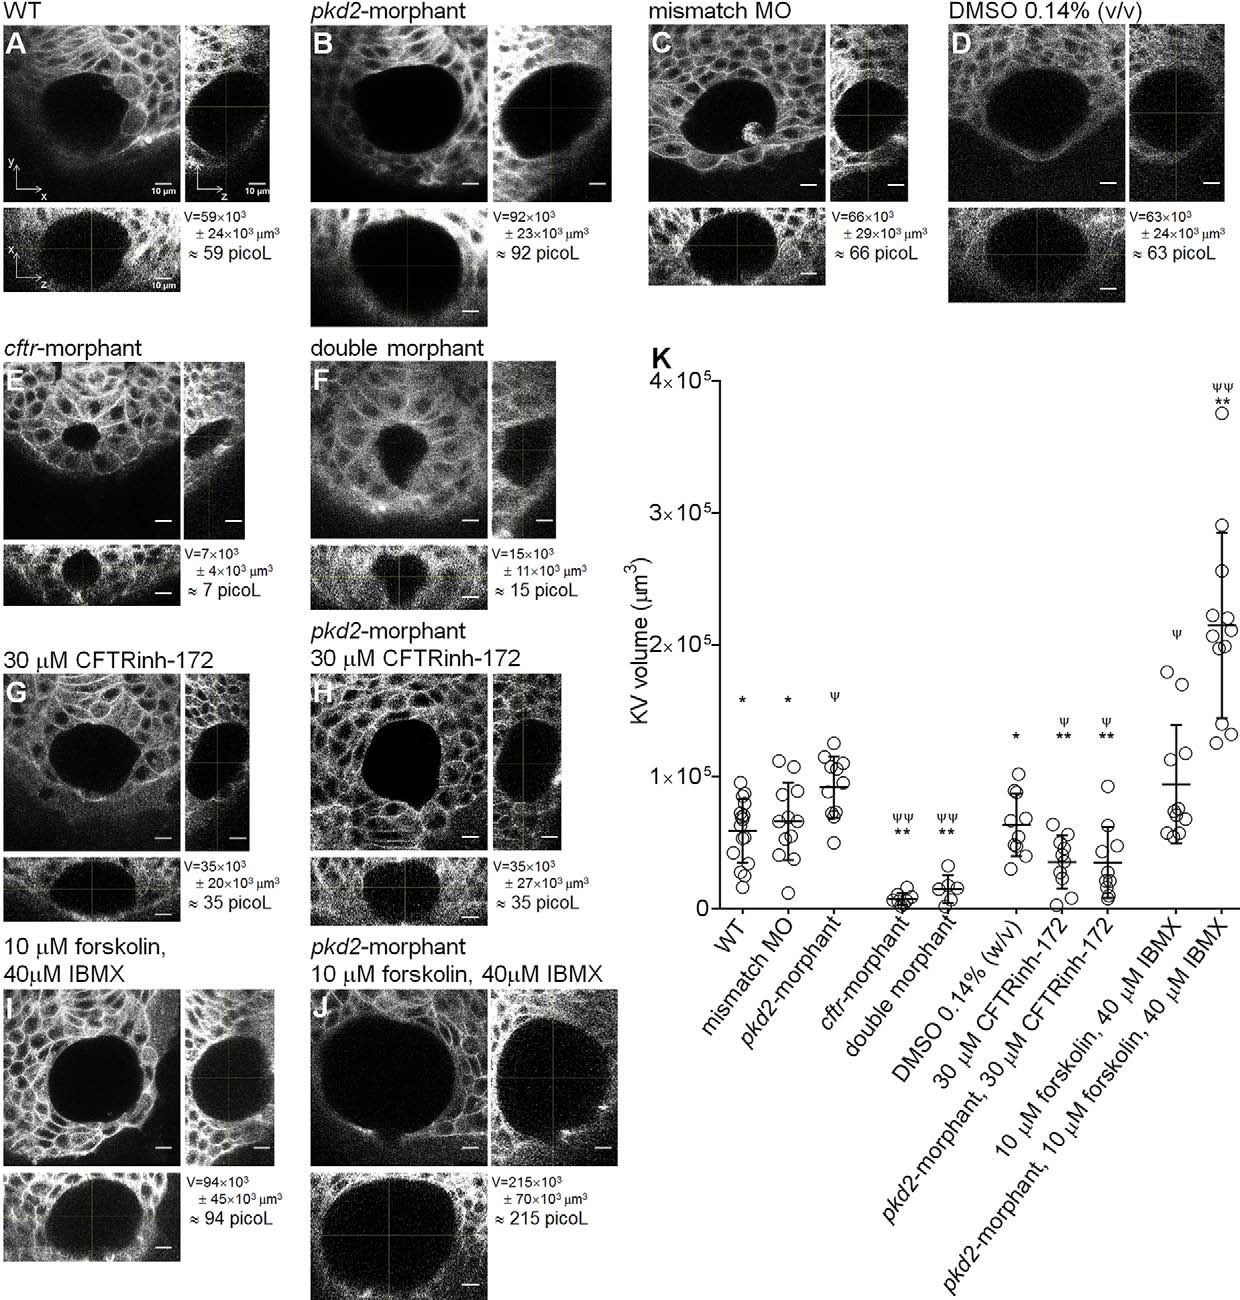
KV volume. (A-J) Confocal live-microscopy scans of the whole KV of 10–11s.s. ras:GFP transgenic embryos. The middle focal plane along the xy axis and the respective orthogonal views (along xz and yz axes) are shown for the most representative WT (A), pkd2-morphant (B), pkd2-mismatch MO (C), 0.14% (v/v) DMSO-treated WT (D), cftr-morphant (E), double-morphant (F), 30µM CFTRinh-172-treated WT (G) and pkd2-morphant (H), and 10µM forskolin+40µM IBMX-treated WT (I) and pkd2-morphant (J) embryos. C is a control for B. D is a control for G,H,I and J. KVvolume is indicated in µm3 and in picol. Scale bars: 10µm. (K) Estimated KV volumes (µm3) for WT (n=16), pkd2-mismatch MO (n=12), pkd2-morphant (n=11), cftr-morphant (n=8), double-morphant (n=6), 0.14% (v/v) DMSO-treated WT (n=10), 30µM CFTRinh-172-treated WT (n=10) and pkd2-morphant (n=10), 10µM forskolin+40µM IBMX-treated WT (n=11) and pkd2-morphant (n=12) embryos. Mean±s.d.; ΨPd0.05 and ΨψP<0.0001, significantly different from WT; *P<0.05 and **P<0.0001, significantly different from pkd2-morphants.