
Image
|
Figure Caption
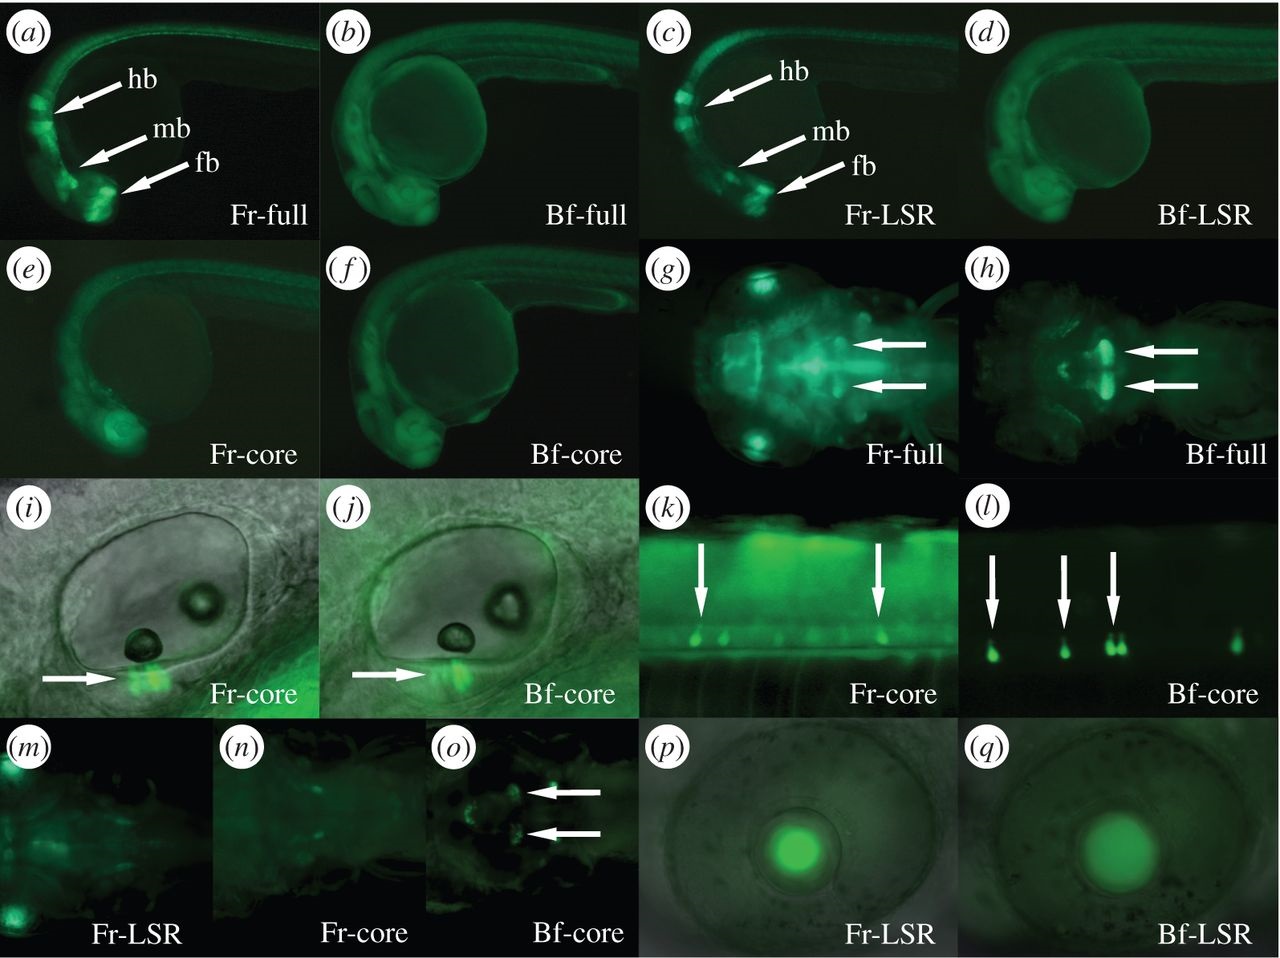
Fig. 2
GFP expression in stable transgenic zebrafish lines induced by different parts of the Fugu (a,c,e,g,i,k,m,n,p) or amphioxus (b,d,f,h,j,l,o,q) CNE at 30 hpf (a–f), 50 hpf (i–l,p,q) and 5 dpf (g,h,m,n,o). Elevated levels of GFP in different brain regions (a,c) are indicated by arrows (fb, forebrain; mb, midbrain; hb, hindbrain). Arrows indicate expression in the hypothalamus (g,h,o), ear (i,j) and spinal cord KA-neurons (k,l).
Acknowledgments
This image is the copyrighted work of the attributed author or publisher, and
ZFIN has permission only to display this image to its users.
Additional permissions should be obtained from the applicable author or publisher of the image.
Full text @ Open Biol.