
Fig. 1
- ID
- ZDB-IMAGE-151208-14
- Publication
- Jensen et al., 2015 - VEGF-B-Neuropilin-1 signaling is spatiotemporally indispensable for vascular and neuronal development in zebrafish
- All Figures
- Figures for Jensen et al., 2015
|
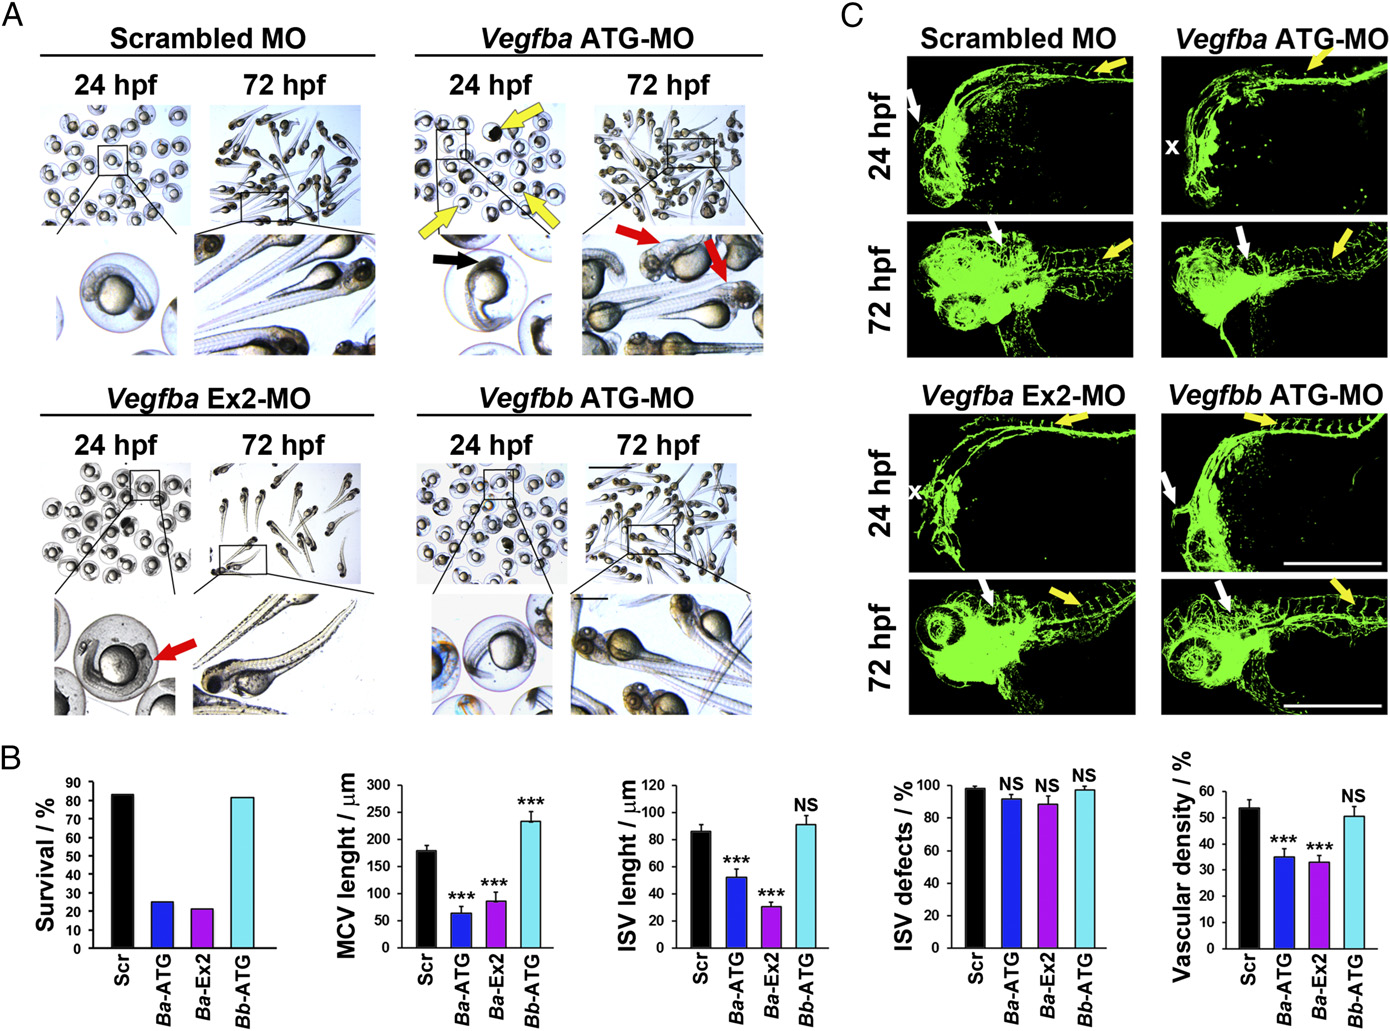
Fig. 1
Gross and vascular phenotypes of Vegfba and Vegfbb knockdown in zebrafish embryos. (A) Micrographs of zebrafish embryos injected with 0.6 pmol of Scrambled, Vegfba-ATG, Vegfba-Ex2, or Vegfbb-ATG–targeted morpholinos, and embryos were visualized at 24 or 72 hpf. Black arrows indicate embryos with widespread cell death in the brain; yellow arrows indicate dead embryos; red arrows indicate embryos with cerebral edema. (Scale bar, 1 mm; in the amplified picture, 200 µm.) (B) Quantifications of the percentage of surviving embryos, MCV and ISV length at 24 hpf, percentage of defective ISVs at 72 hpf, and the vascular density in the brain of 72-hpf embryos injected with 0.6 pmol of Scrambled, Vegfba-ATG (Ba-ATG), Vegfba-Ex2 (Ba-Ex2), or Vegfbb-ATG (Bb-ATG)-targeted morpholinos (average n = 85 embryos/group). NS, nonsignificant; ***P < 0.001. (C) Confocal micrographs of Tg(fli1a:EGFP) embryos at 24 or 72 hpf injected with 0.6 pmol of Scrambled, Vegfba-ATG, Vegfba-Ex2 or Vegfbb-ATG–targeted morpholinos. White arrows point to the MCV or the brain vasculature affected at 72 hpf. White X symbols mark the positions where MCVs were missing. Yellow arrows point to ISVs. (Scale bars, 500 µm.)