
|
Fig. 3
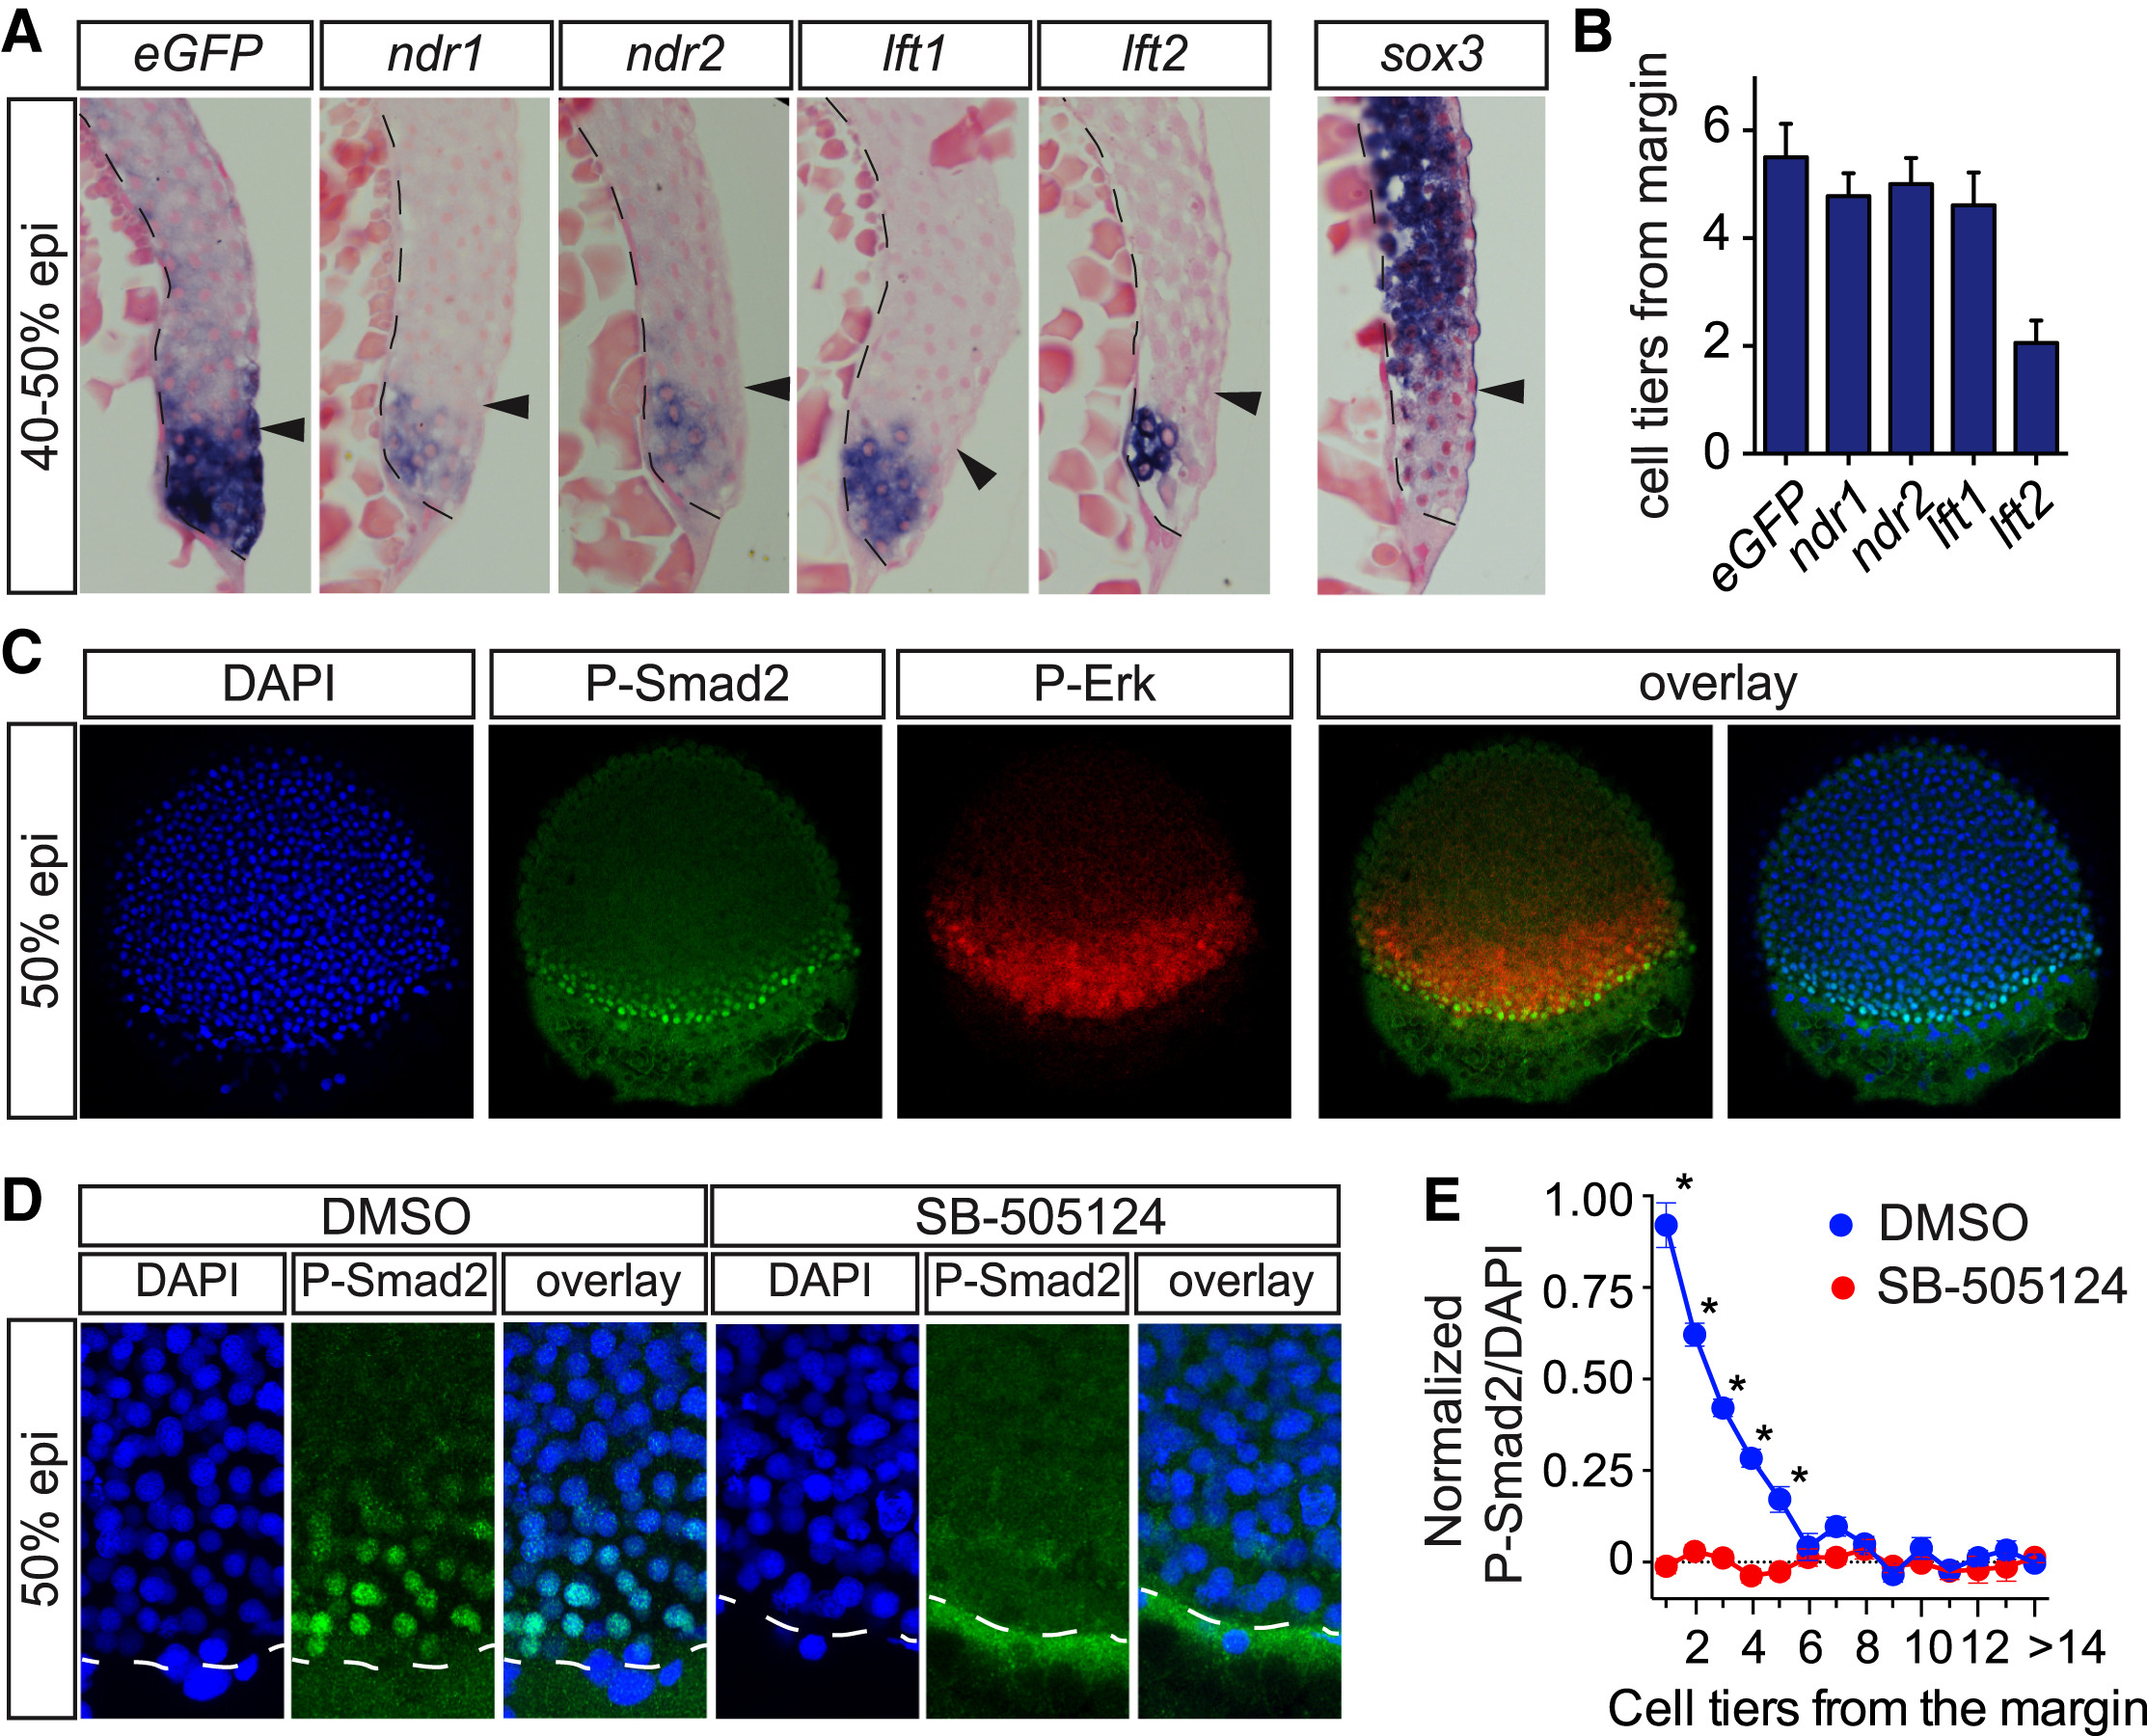
Extent of Nodal Signaling and Target Gene Expression in Tg(ARE:eGFP) Embryos
(A) Sections of 40%–50% epiboly embryos, stained for eGFP, ndr1, ndr2, lft1, lft2, and sox3. Sections were counterstained with Nuclear Fast Red. The black line indicates the border of the YSL and blastoderm; arrowheads indicate five cell tiers.
(B) Quantification of the number of cell tiers that express indicated Nodal target genes, calculated from the margin. Depicted is the mean number of cell tiers ± SD (n = 18).
(C) Whole-mount immunofluorescence of 50% epiboly embryos for P-Smad2 and P-Erk. DAPI labels nuclei. Depicted is a single optical slice of a lateral view.
(D) Immunofluorescence for P-Smad2 in DMSO- and SB-505124-treated 50% embryos. Depicted is a Z-projection of a lateral view. The white dashed line indicates the border of the margin.
(E) Quantification of P-Smad2 immunofluorescence normalized to background signal as a function of the number of cell tiers from the margin in DMSO- and SB-505124-treated embryos. Data were binned in 15 µm intervals to represent the average size of a cell in 50% epiboly embryo (Dubrulle et al., 2015). Depicted are means of each bin obtained from multiple optical slices ± SEM (p < 0.0, t test, n = 3, comparing DMSO- and SB-505124-treated intensities for each cell tier).
See also Figure S5.
Reprinted from Developmental Cell, 35, van Boxtel, A.L., Chesebro, J.E., Heliot, C., Ramel, M.C., Stone, R.K., Hill, C.S., A Temporal Window for Signal Activation Dictates the Dimensions of a Nodal Signaling Domain, 175-185, Copyright (2015) with permission from Elsevier. Full text @ Dev. Cell