
|
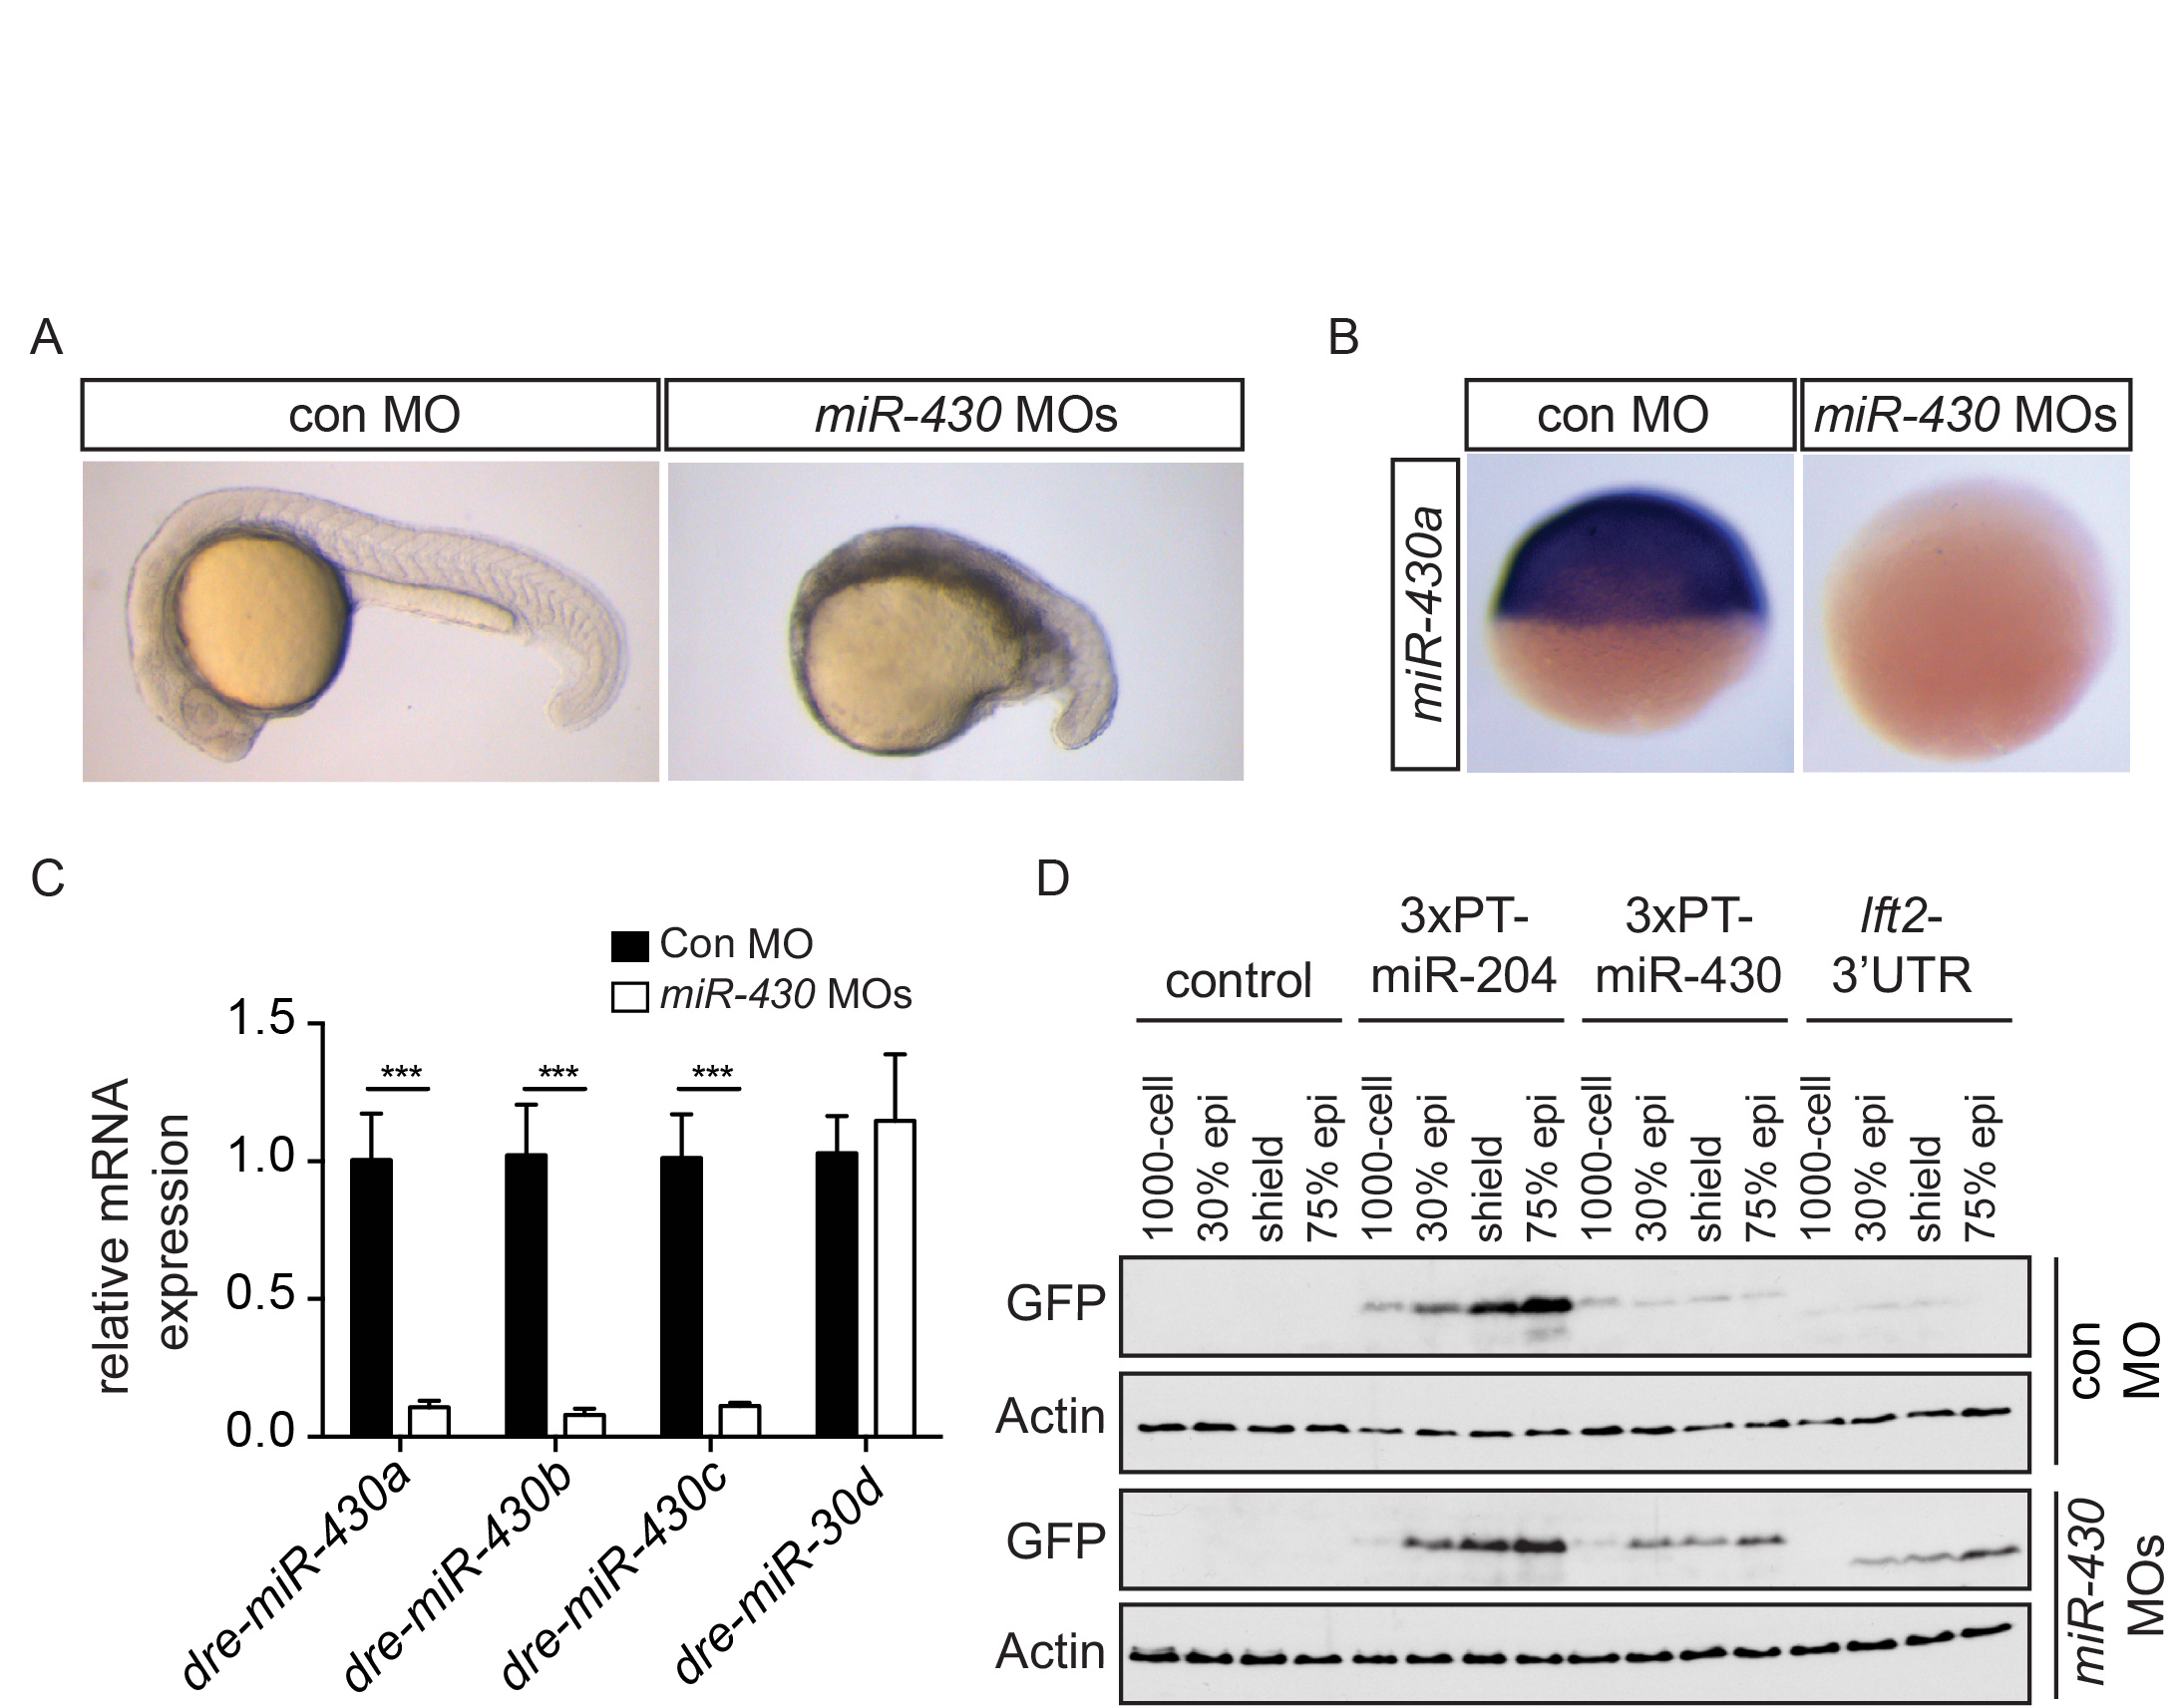
Fig. S7
Specificity of the miR-430 morpholinos
(A) Phenotype of control (con) and miR-430 morpholino-injected embryos at 22 hpf.
(B) WISH for miR-430a with an LNA probe after injection of a mix of miR-430 or control MOs.
(C) qPCR for miR-430a, b and c after injection of control MOs (black bars) or miR-430 MOs (white bars). miR-30d was not affected by miR-430 morpholino injection. The data shown are means normalized to control MO ± SD (*** p-value < 0.001, t-test, n=6)
(D) Western blot for GFP on pooled embryo lysates from uninjected embryos or embryos injected with 50 pg mRNA encoding GFP reporter constructs containing 3′UTRs for miR- 204 (3xPT-miR-204), miR-430 (3xPT-miR-430) or the lft2 3′UTR with either control MO or with miR-430 MOs. miR-430 MOs lead to an increase in translation of the 3xPT-miR- 430 and lft2-3′UTR reporter constructs. Note that the GFP in reporters 3xPT-miR-204 and 3xPT-miR-430 migrates more slowly than that in the lft2 3′UTR reporter due to a membrane tethering tag. Actin is a loading control.
Reprinted from Developmental Cell, 35, van Boxtel, A.L., Chesebro, J.E., Heliot, C., Ramel, M.C., Stone, R.K., Hill, C.S., A Temporal Window for Signal Activation Dictates the Dimensions of a Nodal Signaling Domain, 175-185, Copyright (2015) with permission from Elsevier. Full text @ Dev. Cell