
Fig. 7, S1
- ID
- ZDB-IMAGE-151124-11
- Publication
- Agarwala et al., 2015 - Amotl2a interacts with the Hippo effector Yap1 and the Wnt/β-catenin effector Lef1 to control tissue size in zebrafish
- All Figures
- Figures for Agarwala et al., 2015
|
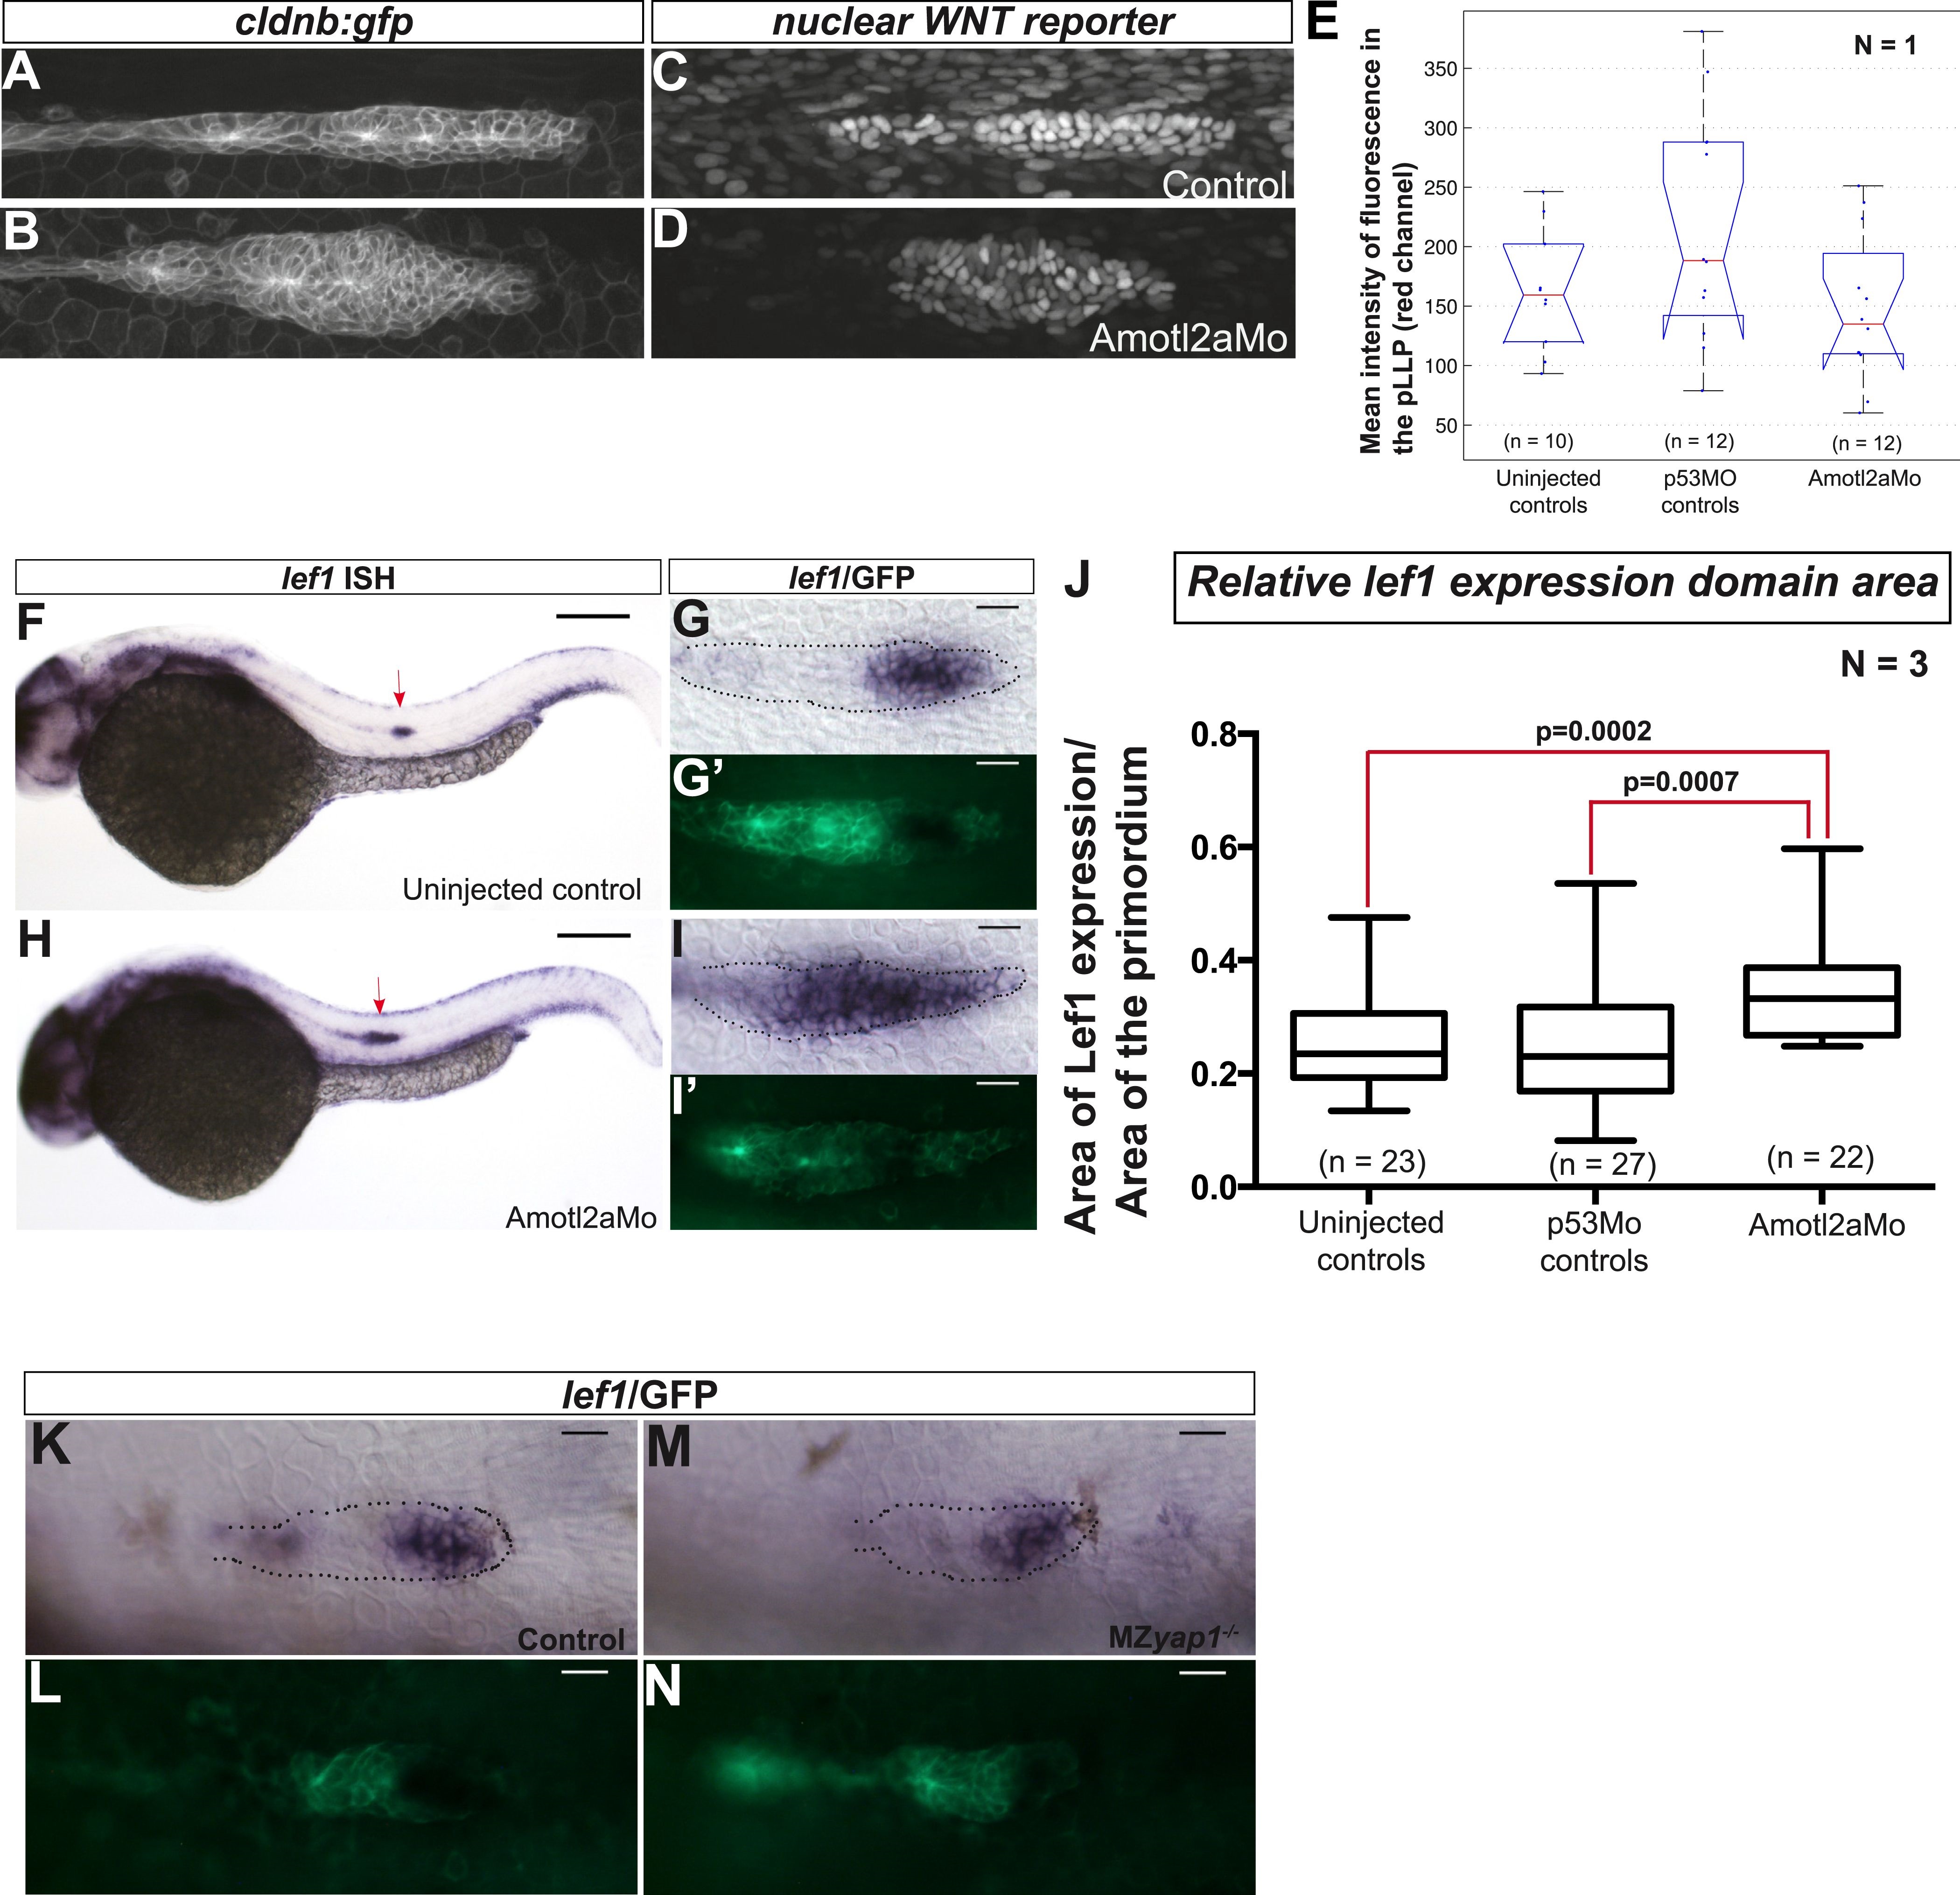
Fig. 7, S1 Loss of Amotl2a leads to an expansion of lef1 expression.
(A–D) MIP of confocal stacks of the pLLP in Tg(7xTCF-Xla.Sia:NLS-mCherry) embryos injected (B, D) or not injected (A, C) with the amotl2aMo and showing the green (membranes, left) and red (nuclear WNT reporter) channels. (E) Boxplot comparing the relative mean intensity of fluorescence in the red channel in the corresponding pLLP. (F–I′) Overview pictures (F, H) and close-up on the pLLP of 30 hpf cldb:gfp embryos injected (H, I, I′) or not injected (F, G, G′) with the Amotl2aMo and stained with a lef1 ISH probe and an anti-GFP antibody (G′, I′). Red arrows point to the pLLP (F, H). (J) Boxplot showing the expansion of lef1 expression domain in amotl2a morphants. (K–N) Close-up on the pLLP of 30 hpf control or MZyap1-/- cldb:gfp embryos stained with a lef1 ISH probe and an anti-GFP antibody (L, N). The relative lef1 expression domain is not different in MZyap1-/- embryos (Figure 7—source data 3).