
|
Fig. S5
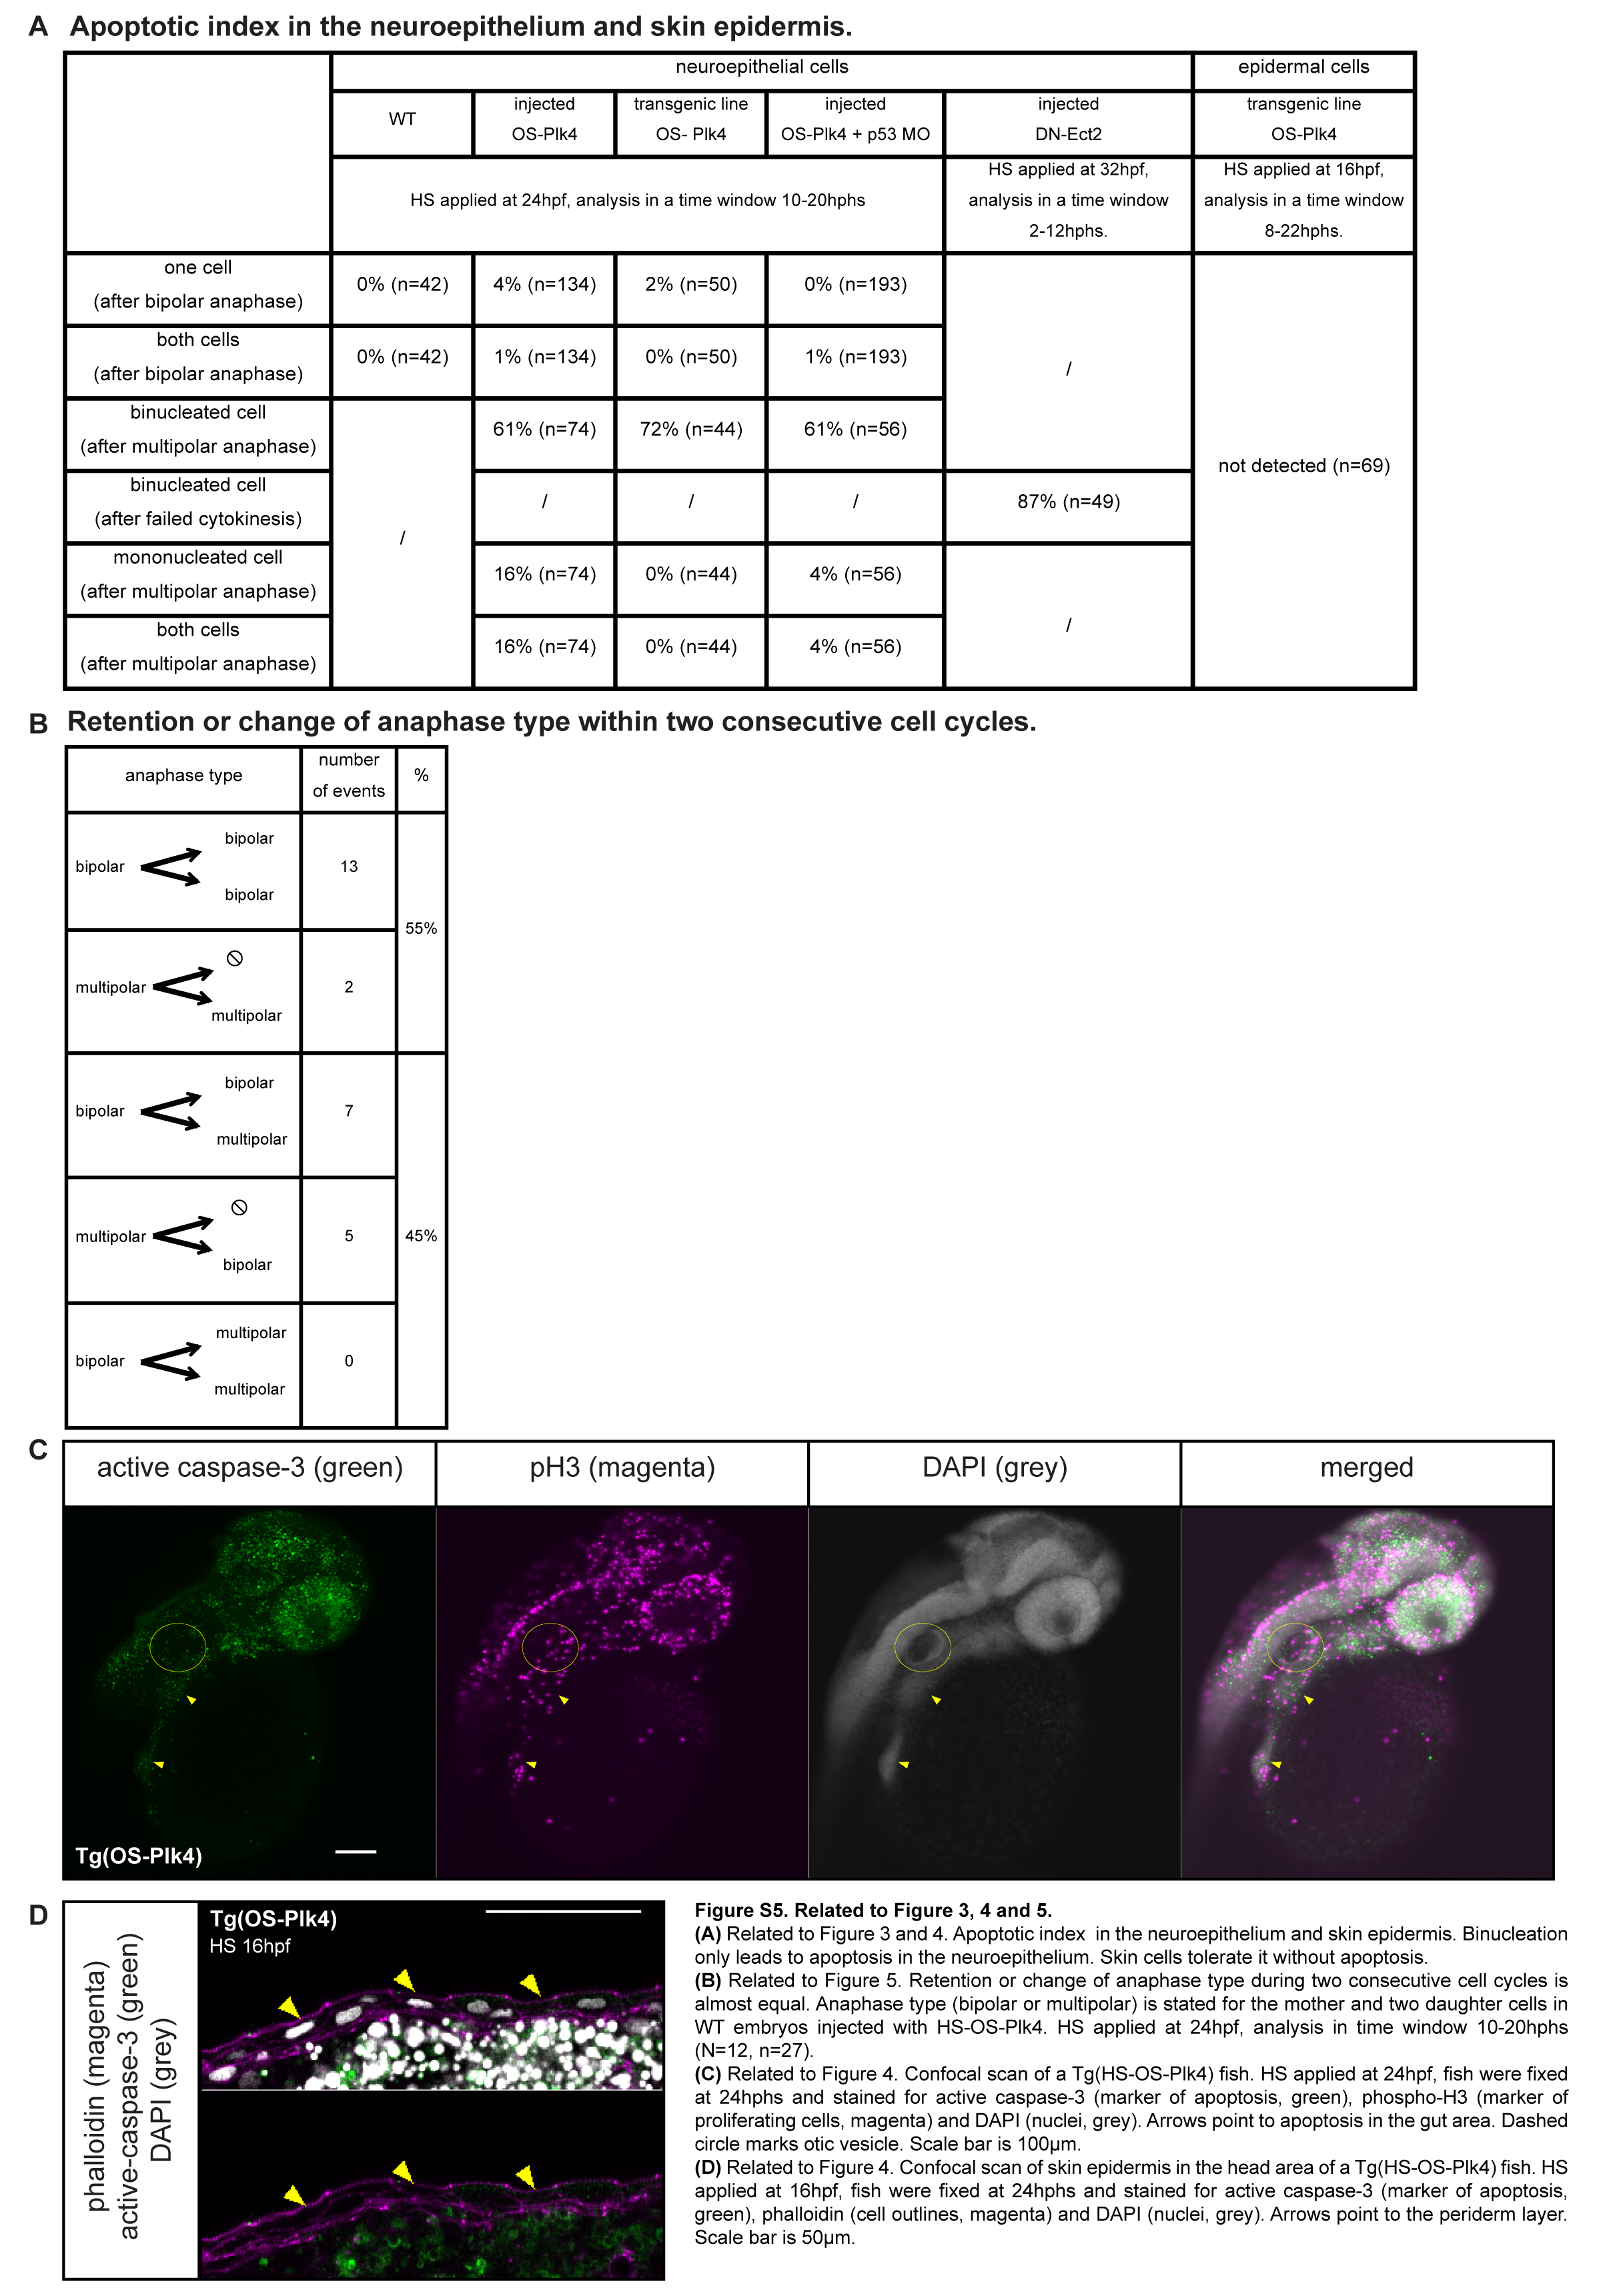
Related to Figure 3, 4 and 5.
(A) Related to Figure 3 and 4. Apoptotic index in the neuroepithelium and skin epidermis. Binucleation only leads to apoptosis in the neuroepithelium. Skin cells tolerate it without apoptosis.
(B) Related to Figure 5. Retention or change of anaphase type during two consecutive cell cycles is almost equal. Anaphase type (bipolar or multipolar) is stated for the mother and two daughter cells in wr embryos injected with HS-OS-Plk4. HS applied at 24hpf, analysis in time window 10-20hphs (N=12, n=27).
(C) Related to Figure 4. Confocal scan of a Tg(HS-OS-Plk4) fish. HS applied at 24hpf, fish were fixed at 24hphs and stained for active caspase-3 (marker of apoptosis, green), phospho-H3 (marker of proliferating cells, magenta) and DAPI (nuclei, grey). Arrows point to apoptosis in the gut area. Dashed circle marks otic vesicle. Scale bar is 1 00µm.
(D) Related to Figure 4. Confocal scan of skin epidermis in the head area of a Tg(HS-OS-Plk4) fish. HS applied at 16hpf, fish were fixed at 24hphs and stained for active caspase-3 (marker of apoptosis, green), phalloidin (cell outlines, magenta) and DAPI (nuclei, grey). Arrows point to the periderm layer. Scale bar is 50µm.