
|
Fig. 2
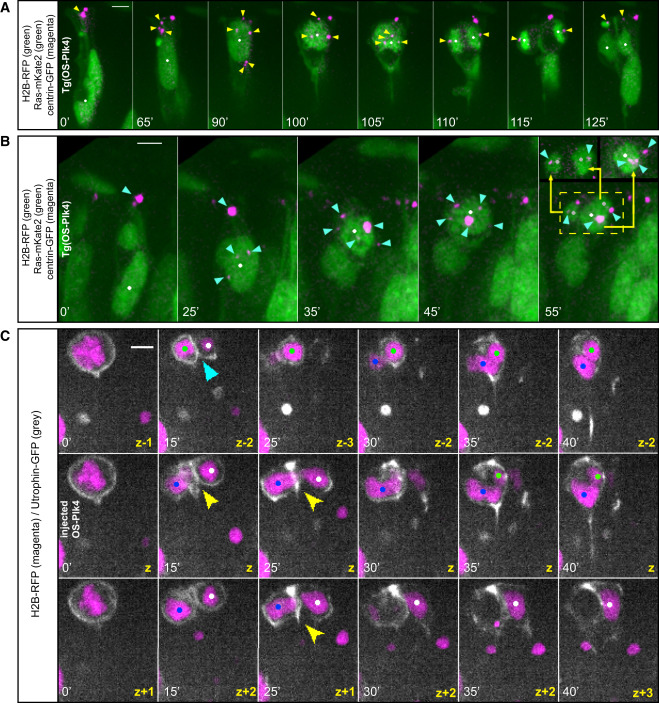
Centriole Amplification Induces Multipolar Anaphases but Bipolar Cytokinesis Generates Binucleated Progeny
(A) Time-lapse images of a neuroepithelial cell in a Tg(HS-OS-Plk4) embryo with a bipolar anaphase. H2B-RFP labels chromatin, Ras-mKate2 labels cell outline (both green), and centrin-GFP labels centrosomes (magenta). The yellow arrows mark the position of amplified centrioles (magenta). Nuclei are highlighted with dots. Frames are from Movie S1.
(B) Time-lapse images of a neuroepithelial cell in a Tg(HS-OS-Plk4) embryo with a multipolar anaphase. H2B-RFP labels chromatin, Ras-mKate2 labels cell outline (both green), and centrin-GFP labels centrosomes (magenta). The blue arrows mark the position of amplified centrioles (magenta). In the insets of the last frame. the daughter nuclei are shown in two different z planes to distinguish three separate nuclei. Nuclei are highlighted with dots. Frames are from Movie S1.
(C) Time-lapse images of a neuroepithelial cell during cytokinesis in three different z planes in an embryo injected with HS-OS-Plk4, HS-H2B-RFP (chromatin, magenta), and HS-utrophin-GFP (F-actin, gray). Colored dots mark three daughter nuclei. Blue arrow marks a cytokinetic furrow that later regresses, and yellow arrows mark a cytokinetic furrow that divides three daughter nuclei into two cells. A mononucleated cell is marked with a white dot, and a binucleated cell is marked with a blue dot and a green dot. Frames are from Movie S2.
For all panels: HS was applied at 24 hpf, and imaging started at 10 hphs. Scale bars, 5 µm. Time is given in minutes.
See also Movies S1 and S2.