
Fig. 5
- ID
- ZDB-IMAGE-151119-21
- Publication
- Walton et al., 2015 - The Macrophage-Specific Promoter mfap4 Allows Live, Long-Term Analysis of Macrophage Behavior during Mycobacterial Infection in Zebrafish
- All Figures
- Figures for Walton et al., 2015
|
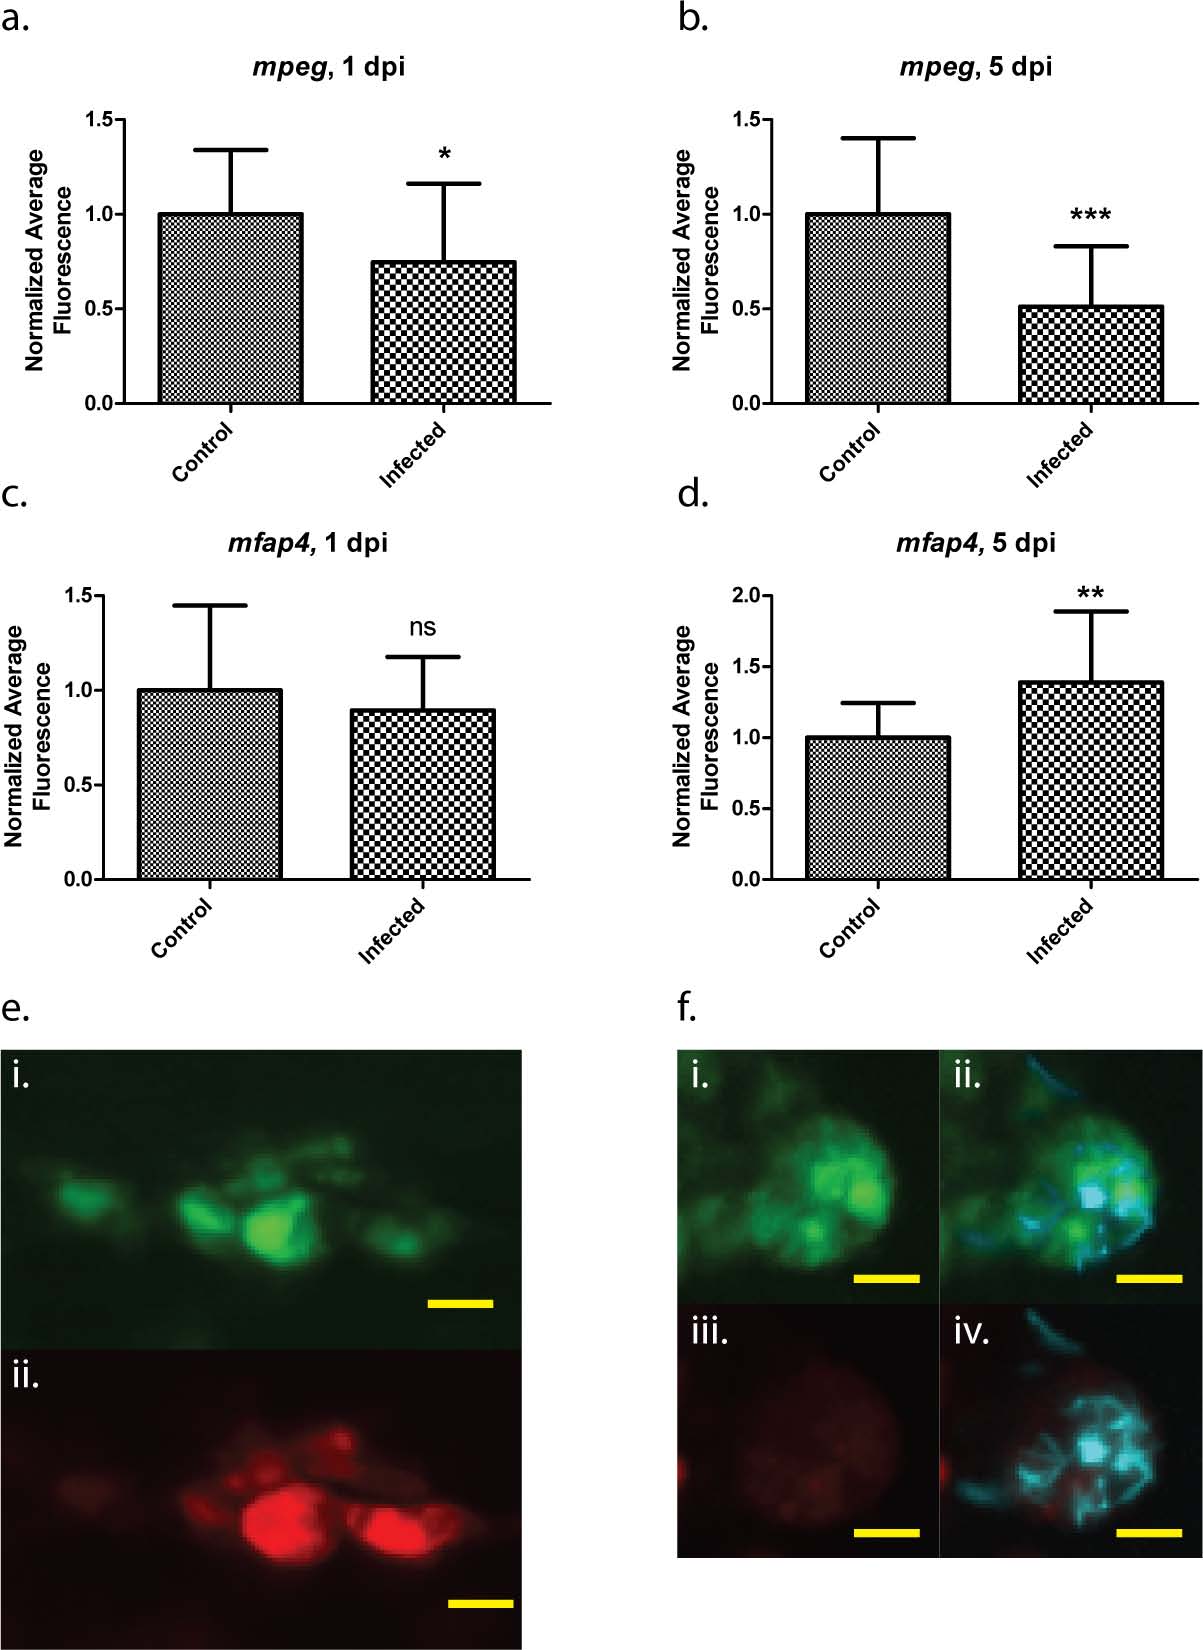
Fig. 5
Differential regulation of mfap4 and mpeg1 transgenes during mycobacterial infection.
Average fluorescence values of either mpeg1:tdTomato-CAAX or mfap4:dLanYFP-CAAX fluorescent proteins relative to uninfected, age-matched controls. Five randomly chosen infected macrophages per larva (“Infected”), or five randomly chosen macrophages within uninfected larvae (“Control”) were assessed. 20 larvae were analyzed for each of the infected and control groups at 1 dpi as well as for the Infected group at 5 dpi; 19 larvae were analyzed for the Control group at 5 dpi. Both tdTomato fluorescence (a,b) and dLanYFP fluorescence (c,d) were measured for the same pool of cells from each larva. e. Representative image of mfap4 transgene expression (i) and mpeg1 transgene expression (ii) within the same group of cells in an uninfected Control larva, 5 dpi. f. Representative image of mfap4 transgene expression (i) and mpeg1 transgene expression (iii) within the same group of cells in an Infected larva, 5 dpi; also shown are merged images of fluorescent M. marinum (cyan signal) with the YFP (ii) and tdTomato (iv) channels. Note the almost total loss of mpeg1-mediated fluorescence within the infected group of cells, while mfap4 transgene fluorescence remains robust. Scale bars = 10 µm. * p < .05, ** p < .005, *** p = .0002. Student’s t-test with Welch’s correction for unequal variances. Error bars indicate +/- SD.