
IMAGE
Fig. S2
- ID
- ZDB-IMAGE-151110-21
- Publication
- D'Aniello et al., 2015 - Rdh10a Provides a Conserved Critical Step in the Synthesis of Retinoic Acid during Zebrafish Embryogenesis
- All Figures
- Figures for D'Aniello et al., 2015
Image
|
Figure Caption
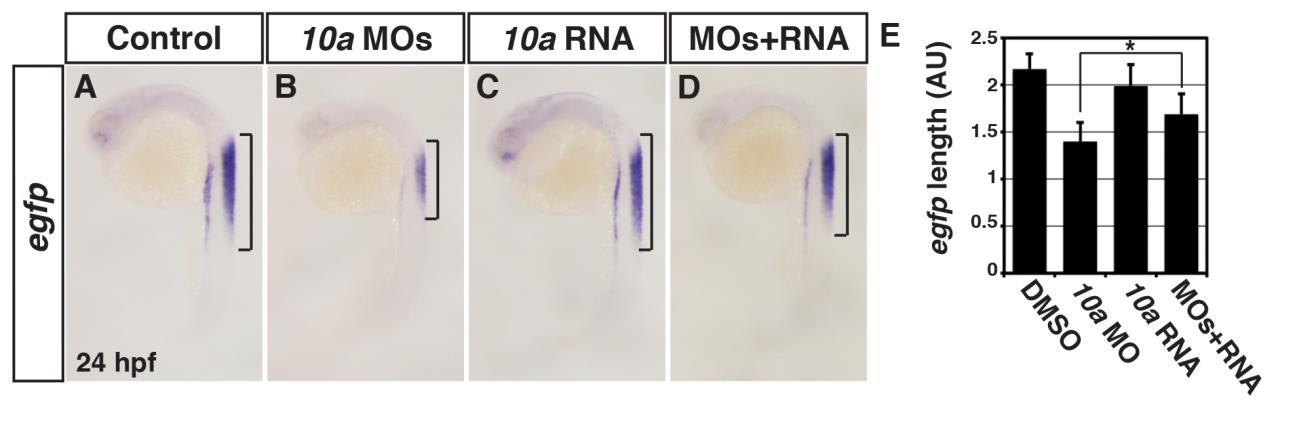
Fig. S2 Specificity controls for the Rdh10a MOs.
(A-D) ISH for egfp expression in Tg(12XRARE-ef1a:EGFP)sk72 control sibling (n = 13), Rdh10a deficient (n = 21), rdh10a mRNA injected (n = 20), and Rdh10a deficient + rdh10a mRNA injected embryos (n = 14). Brackets indicate the length of egfp expression in the spinal cord. Images are lateral views at 24 hpf. (E) Measurements of egfp expression length in the spinal cord of Tg(12XRARE-ef1a:EGFP)sk72 embryos in arbitrary units (AU).
Acknowledgments
This image is the copyrighted work of the attributed author or publisher, and
ZFIN has permission only to display this image to its users.
Additional permissions should be obtained from the applicable author or publisher of the image.
Full text @ PLoS One