
IMAGE
Fig. 6
- ID
- ZDB-IMAGE-151110-17
- Genes
- Publication
- D'Aniello et al., 2015 - Rdh10a Provides a Conserved Critical Step in the Synthesis of Retinoic Acid during Zebrafish Embryogenesis
- All Figures
- Figures for D'Aniello et al., 2015
Image
|
Figure Caption
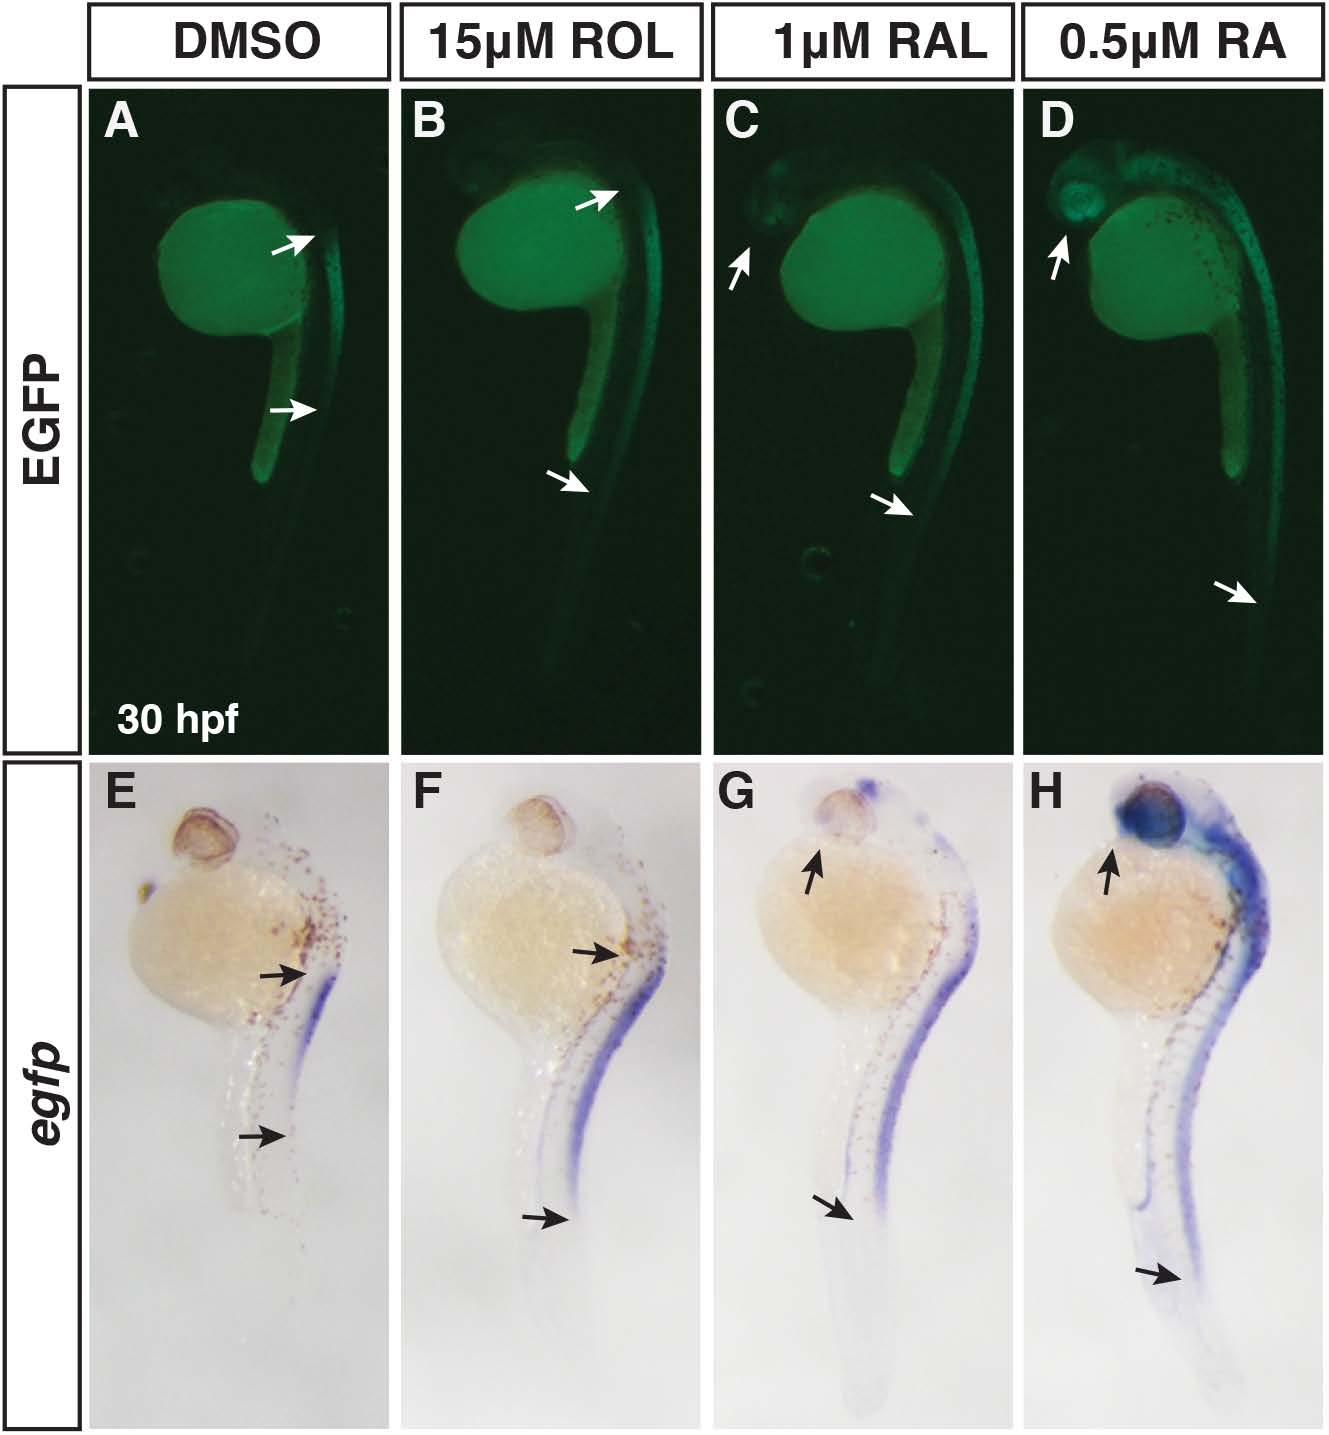
Fig. 6 Differential abilities of ROL, RAL, and RA to promote RA signaling.
(A-D) EGFP fluorescence in Tg(12XRARE-ef1a:EGFP)sk72 embryos after treatment with 15 µM ROL, 1 µM RAL, and 0.5 µM RA beginning at 24 hpf. (E-H) ISH for egfp expression in Tg(12XRARE-ef1a:EGFP)sk72 embryos after treatment with 15 µM ROL, 1 µM RAL, and 0.5 µM RA beginning at 24 hpf. Arrows indicate the boundaries of expression. Views are lateral with dorsal right and anterior up.
Figure Data
Acknowledgments
This image is the copyrighted work of the attributed author or publisher, and
ZFIN has permission only to display this image to its users.
Additional permissions should be obtained from the applicable author or publisher of the image.
Full text @ PLoS One