
Fig. 2
- ID
- ZDB-IMAGE-151106-24
- Genes
- Publication
- Ningappa et al., 2015 - The Role of ARF6 in Biliary Atresia
- All Figures
- Figures for Ningappa et al., 2015
|
Fig. 2
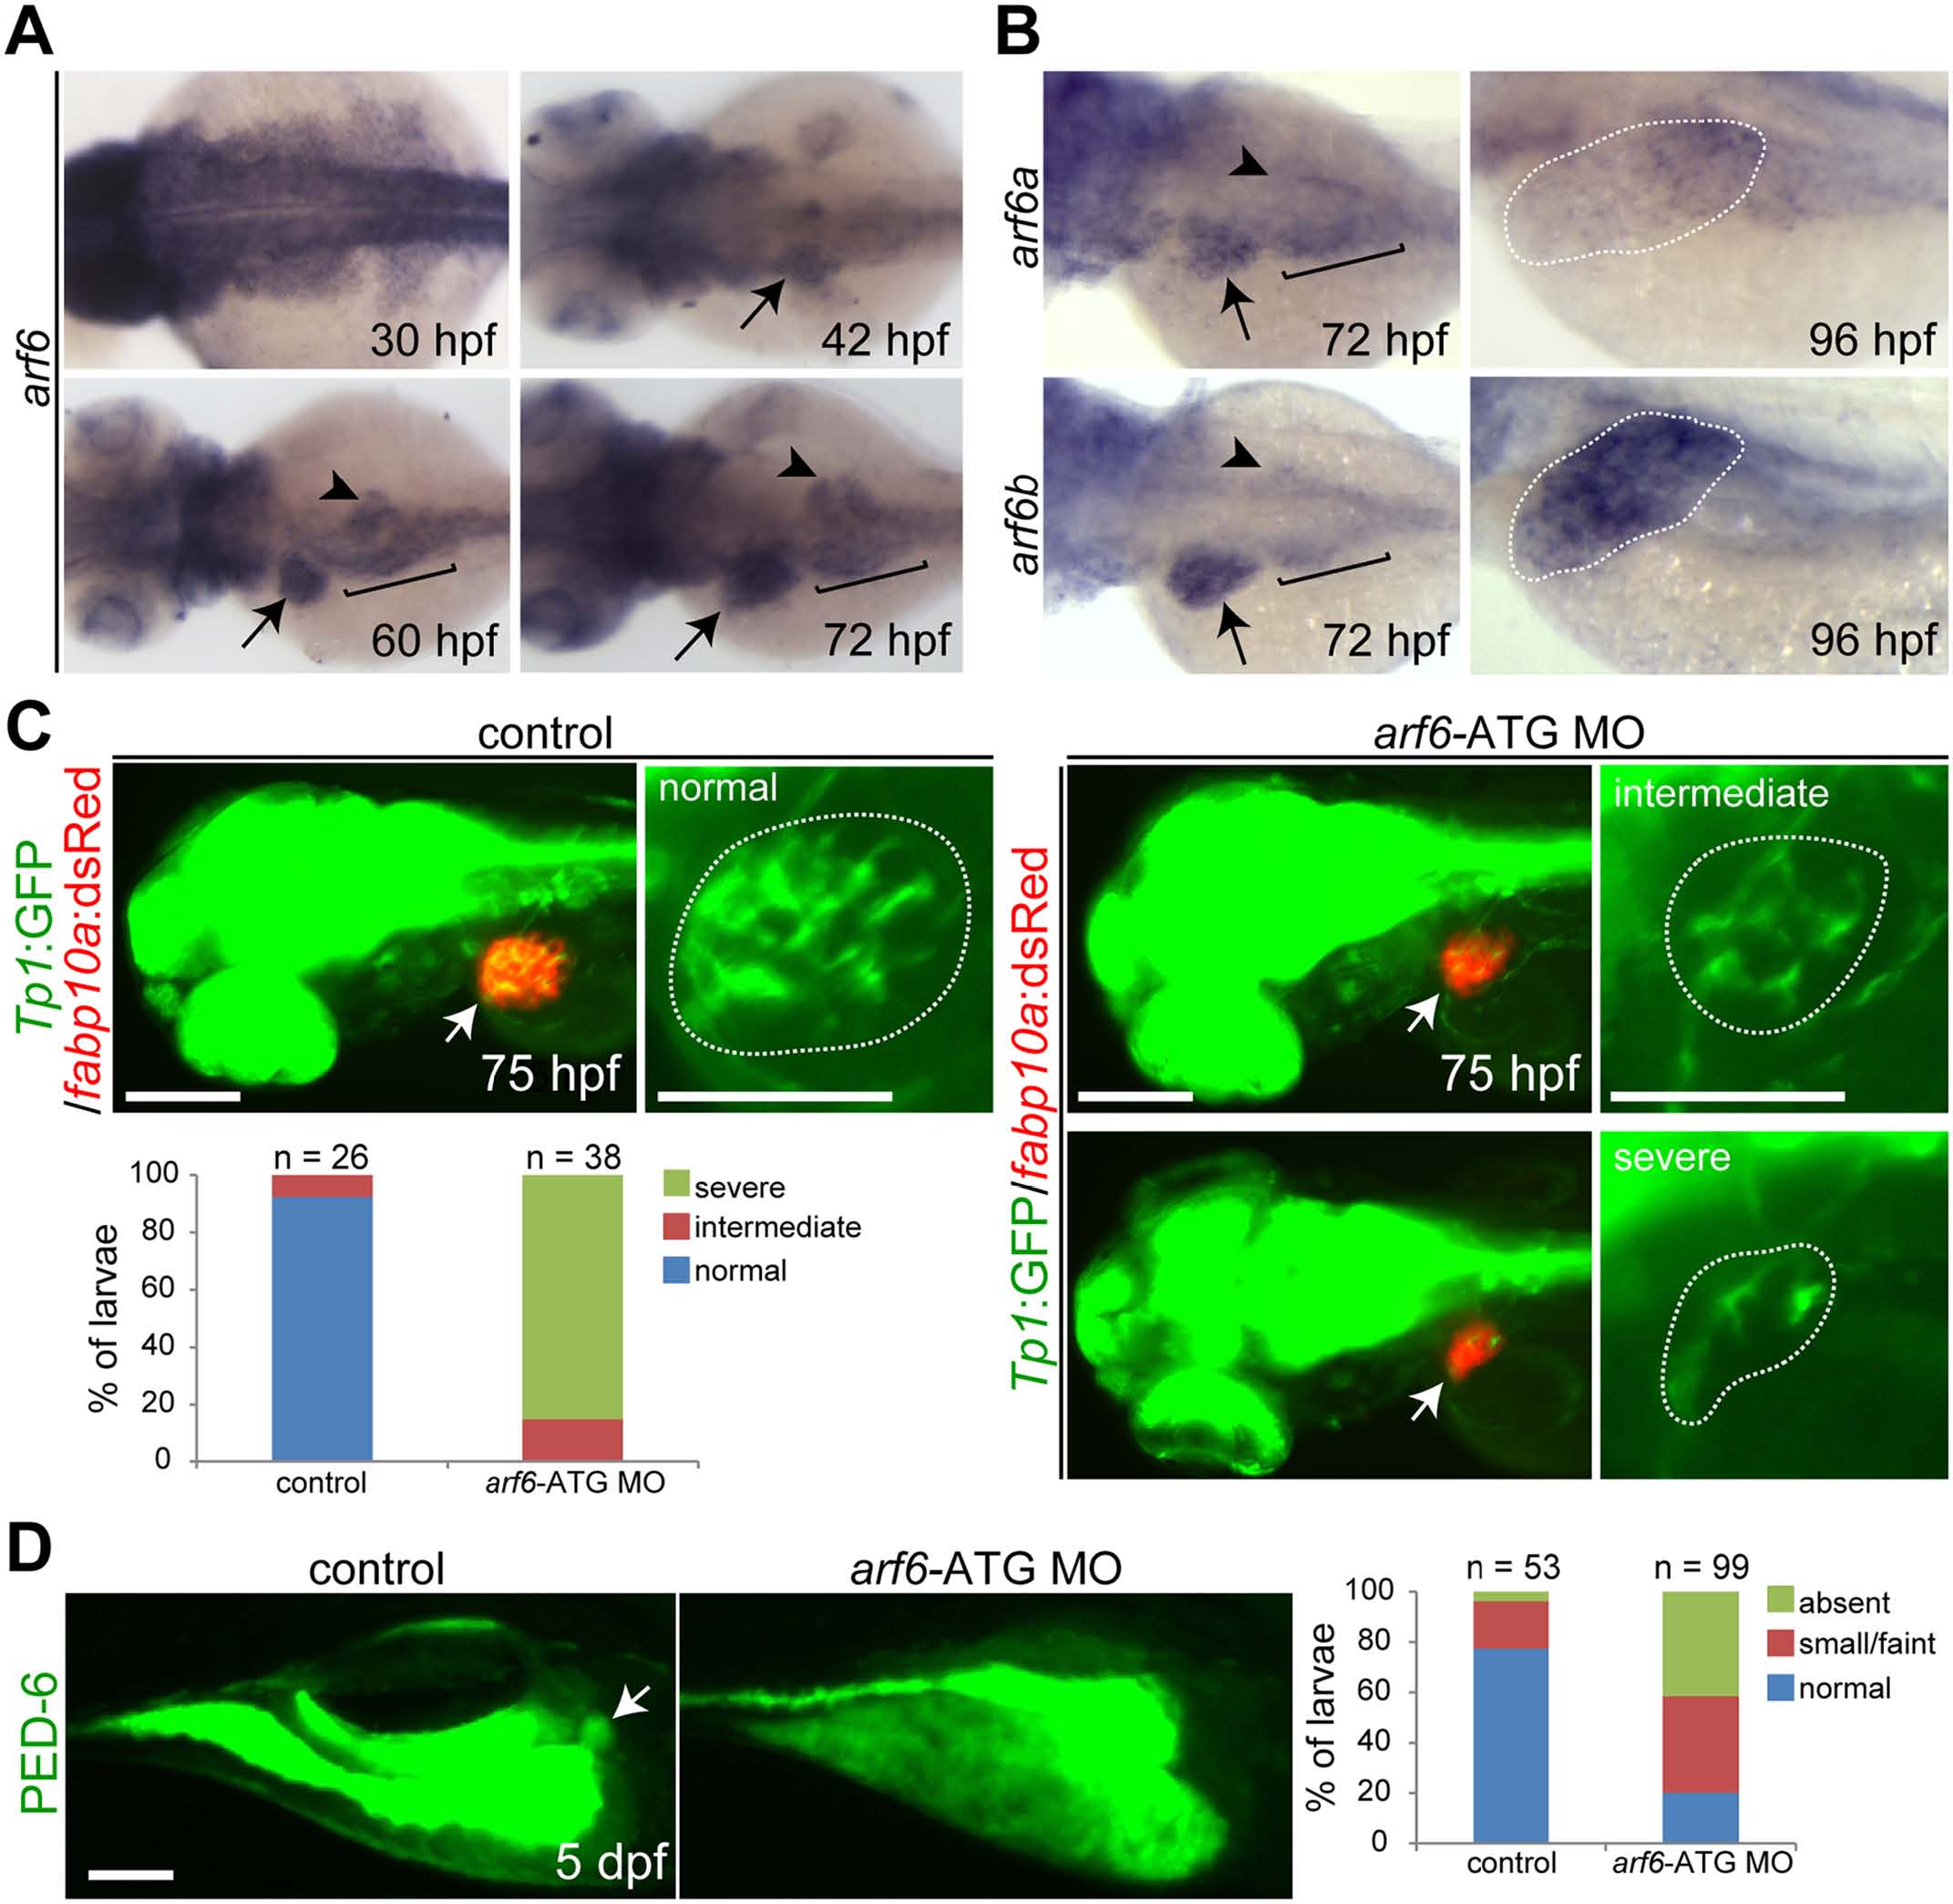
arf6 knockdown results in developmental biliary defects in zebrafish.
(A, B) Whole-mount in situ hybridization showing arf6a and arf6b expression in developing embryos/larvae. Arrows point to the liver; arrowheads the pancreas; brackets mark the intestinal bulb. (C) The Tg(Tp1:GFP) and Tg(fabp10a:dsRed) lines reveal the intrahepatic biliary structure and liver size, respectively. Epifluorescence images showing the expression of these transgenes revealed a defect in the intrahepatic biliary structure in arf6-ATG MO-injected larvae. Based on the severity of the biliary defect, larvae were divided into three groups: normal, intermediate, and severe. Graph shows the percentage of larvae in each group. Arrows point to the liver; dotted lines outline the liver (A-C). (D) Epifluorescence images showing PED-6 accumulation in the gallbladder (arrows). Based on PED-6 levels in the gallbladder, larvae were divided into three groups: absent, small/faint, and normal. Graph shows the percentage of larvae in each group. n, the number of larvae examined; scale bars, 100 µm.