
Fig. 9
- ID
- ZDB-IMAGE-151102-36
- Genes
- Publication
- Ghaye et al., 2015 - Progenitor potential of nkx6.1-expressing cells throughout zebrafish life and during beta cell regeneration
- All Figures
- Figures for Ghaye et al., 2015
|
Fig. 9
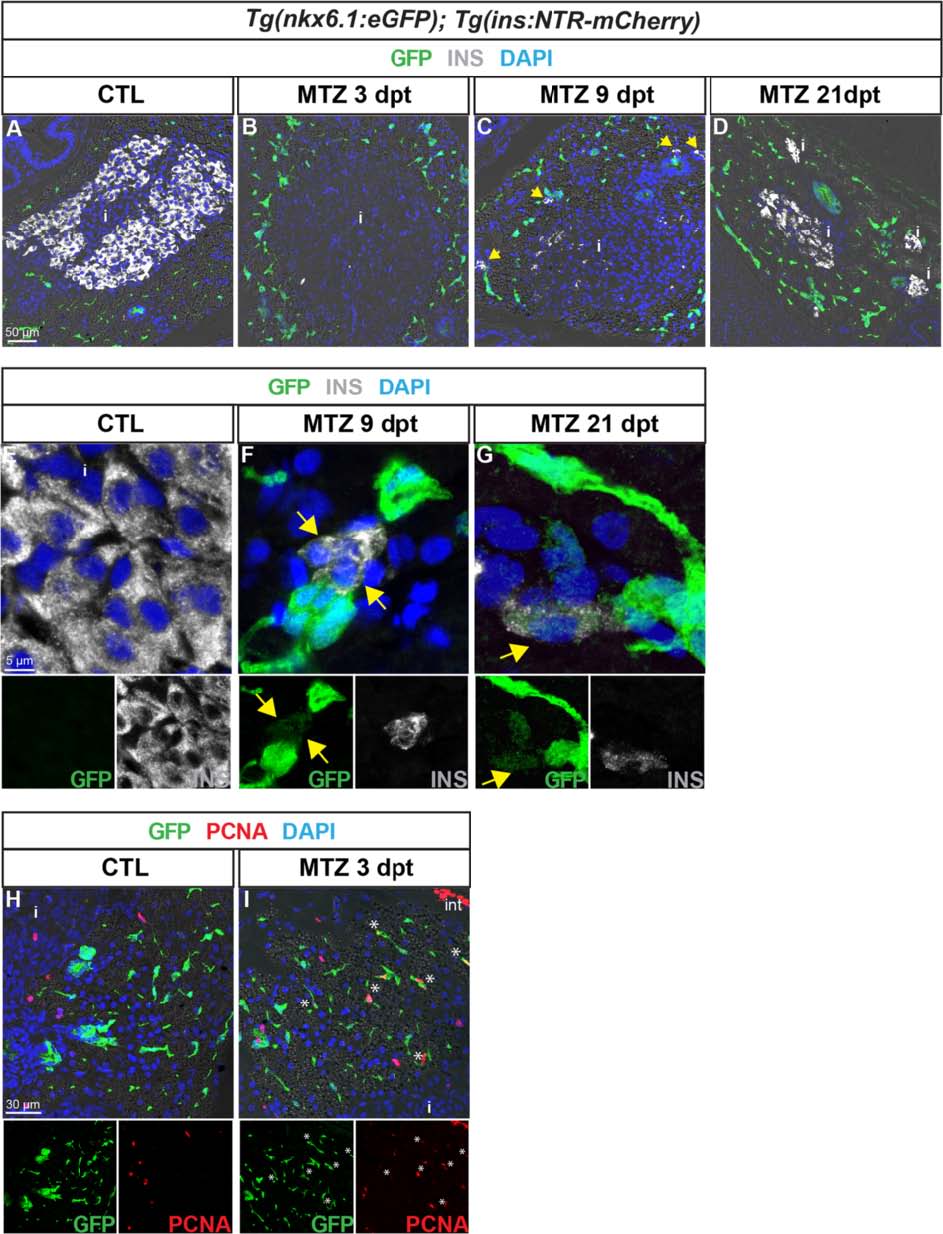
nkx6.1:eGFP+ cells proliferate and differentiate into new insulin-expressing cells after beta cell specific ablation. GFP (green) and Ins (white) labeling in the pancreas of Tg(nkx6.1:eGFP); Tg(ins:NTR-mCherry) adult fish. a, b Non-treated fish (CTL, a) show intense Ins staining in beta cells, while Ins+ cells are not detected 3 dpt with MTZ, indicating efficient ablation (b). Note that debris of one beta cell (Ins+) is observed in the islet. c At 9 dpt, Ins-expressing cells start to be detected in the principal islet and in extra-insular locations close to ductal GFP+ cells (yellow arrows). d At 21 dpt, islets show intense Ins staining consistent with beta cell recovery. e–g (and separate channels) While GFP is never detected in beta cells of control fish (e), some regenerating Ins+ cells display weak GFP labeling at both stages of regeneration analyzed, i.e. at 9 dpt (f) and 21 dpt (g). h, i (and separate channels) Beta cell ablation triggers proliferation of CACs as shown at 3 dpt (h) compared to CTL (i) (asterisks). i islet