
|
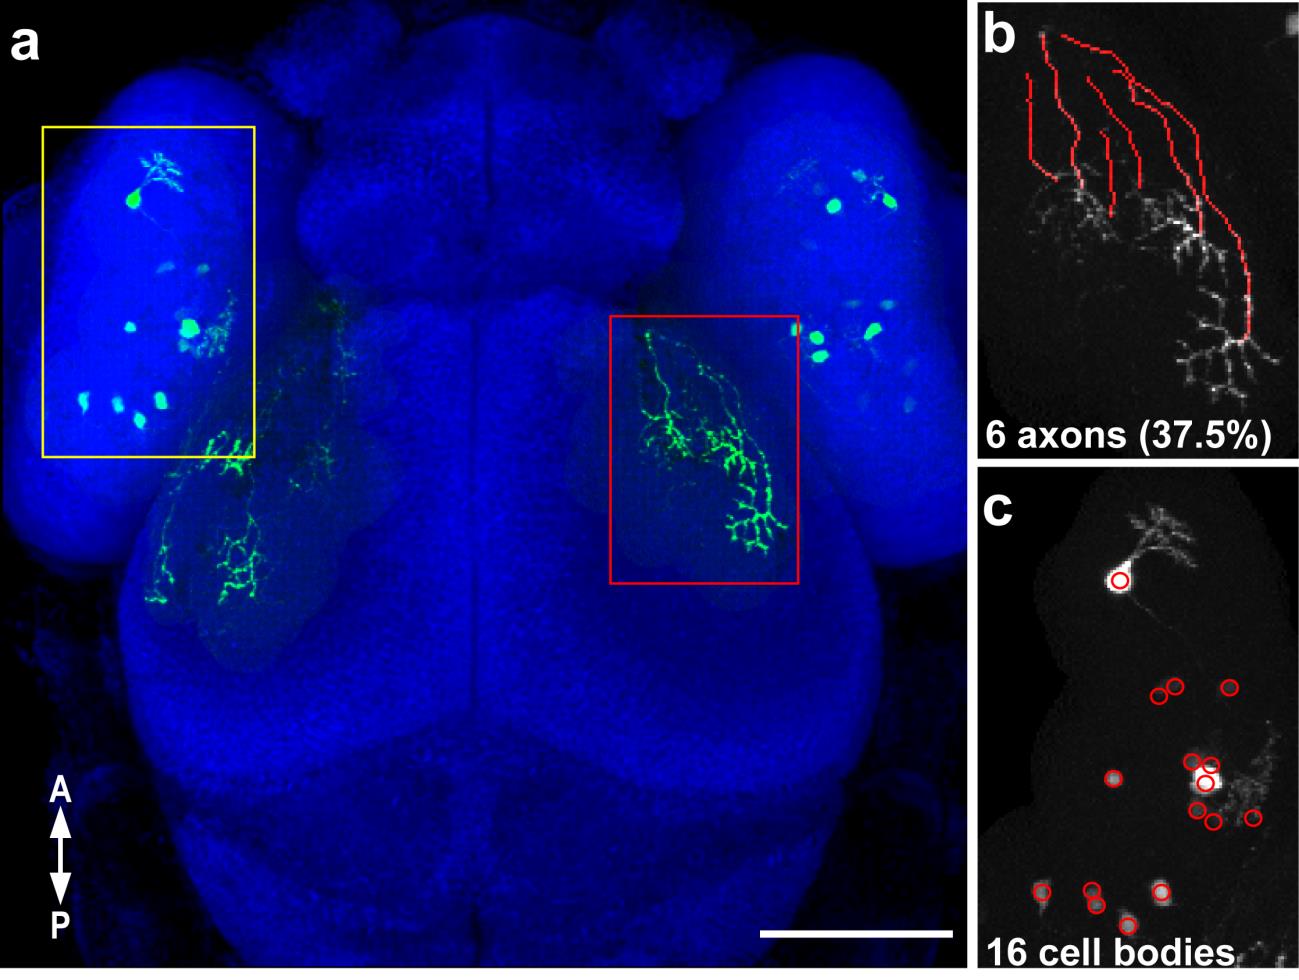
Fig. S4
Quantification of the ratio of labeled RGC axons to labeled cell bodies in Fig 5.
(a) Confocal projection (30x silicone immersion lens) of a 3 dpf embryo with transient expression of isl2b:emGFP, with labeled RGC axons (a red rectangle, b) and labeled cell bodies (yellow rectangle, c) that were counted. Axons were traced in the dorsal optic tract and tectum using the Fiji simple neurite tracer plugin (b). (c) The cell counter plugin in ImageJ was used to mark and count labeled cells in the contralateral retina. The ratio of labeled axons to labeled cell bodies per retinotectal projection was calculated (37.5%). Scale bar is 100 µm.