
|
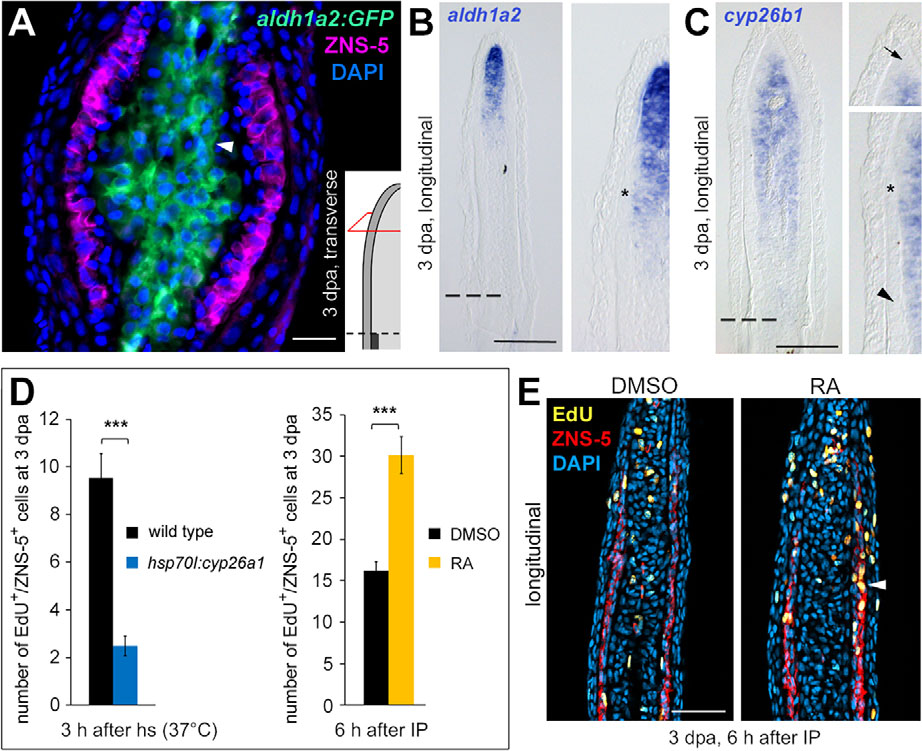
Fig. 4
RA signaling promotes osteoblast proliferation. (A) IHC for ZNS-5 and GFP in aldh1a2:gfp fish at 3dpa reveals aldh1a2 expression in fibroblast-derived blastema cells (arrowhead). (B) ISH for aldh1a2 at 3dpa shows that expression is strongest in fibroblast-derived cells in the distal blastema but weak expression reaches far proximally. Asterisk indicates distal leading edge of preosteoblasts. (C) ISH for cyp26b1 at 3dpa demonstrates expression in fibroblast-derived cells of the proximal medial blastema. Note absence of expression in the distal blastema (arrow) and in osteoblasts. Asterisk indicates distal leading edge of preosteoblasts, arrowhead denotes redifferentiated osteoblasts. (D,E) Inhibition of RA signaling in hsp70I:cyp26a1 fish at 3dpa downregulates osteoblast proliferation. RA injection causes an increase in osteoblast proliferation at 6h after IP. (D) EdU+/ZNS-5+ cells per section at 3dpa. (E) IHC for ZNS-5 combined with EdU labeling. Arrowhead indicates EdU+/ZNS-5+ cell. Data are represented as mean±s.e.m. ***P<0.001. Dashed lines indicate amputation planes. Scale bars: 20µm in A; 100µm in B,C,E. h, hours; hs, heat shock.