Image
Figure Caption
Fig. S2
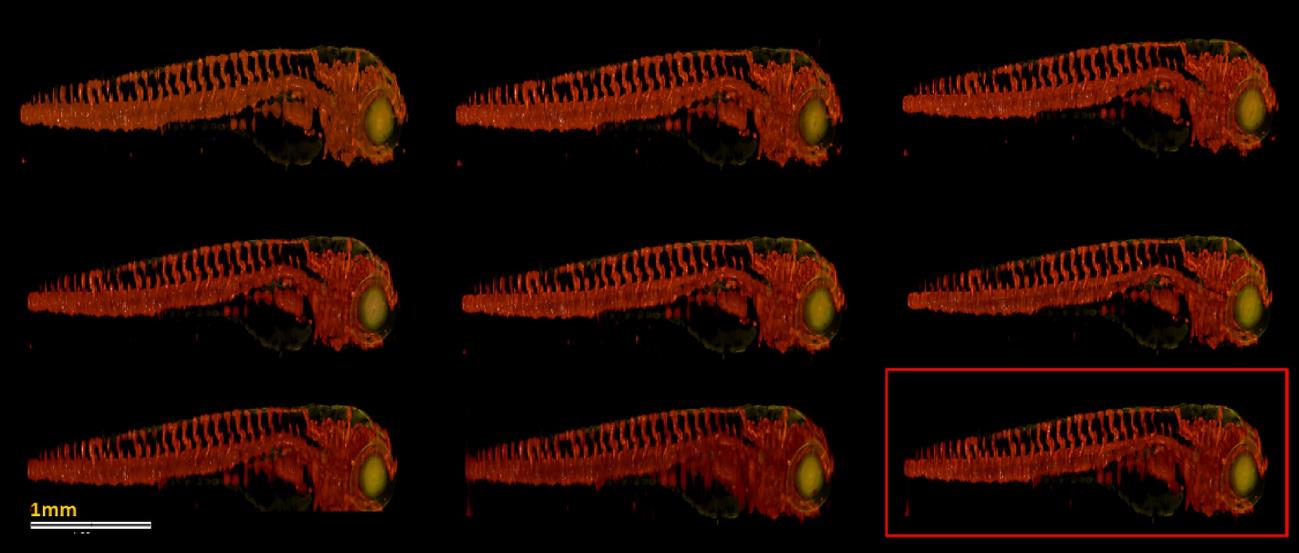
TraNac Tg(KDR:mCherry) zebrafish embryo images reconstructed from the down-sampled data set consisting of 50 fluorescence projections [red] using different algorithm parameters.
Images reconstructed using (top) τ = 0.002, (middle) τ = 0.006 and (bottom) τ = 0.01 and (left) 5, (centre) 20 and (right) 40 TV iterations. The image that resulted in the highest SSIM is marked by the red square. However, no major differences are observed between the images. The transmission volumetric image [green] is displayed to provide an anatomical reference. Scale bar pertains to all images.
Acknowledgments
This image is the copyrighted work of the attributed author or publisher, and
ZFIN has permission only to display this image to its users.
Additional permissions should be obtained from the applicable author or publisher of the image.
Full text @ PLoS One

