Fig. 2
Pharmacological Inhibition of Cholinergic Nerve Function Reduces Cardiomyocyte Proliferation in Zebrafish and Neonatal Mice
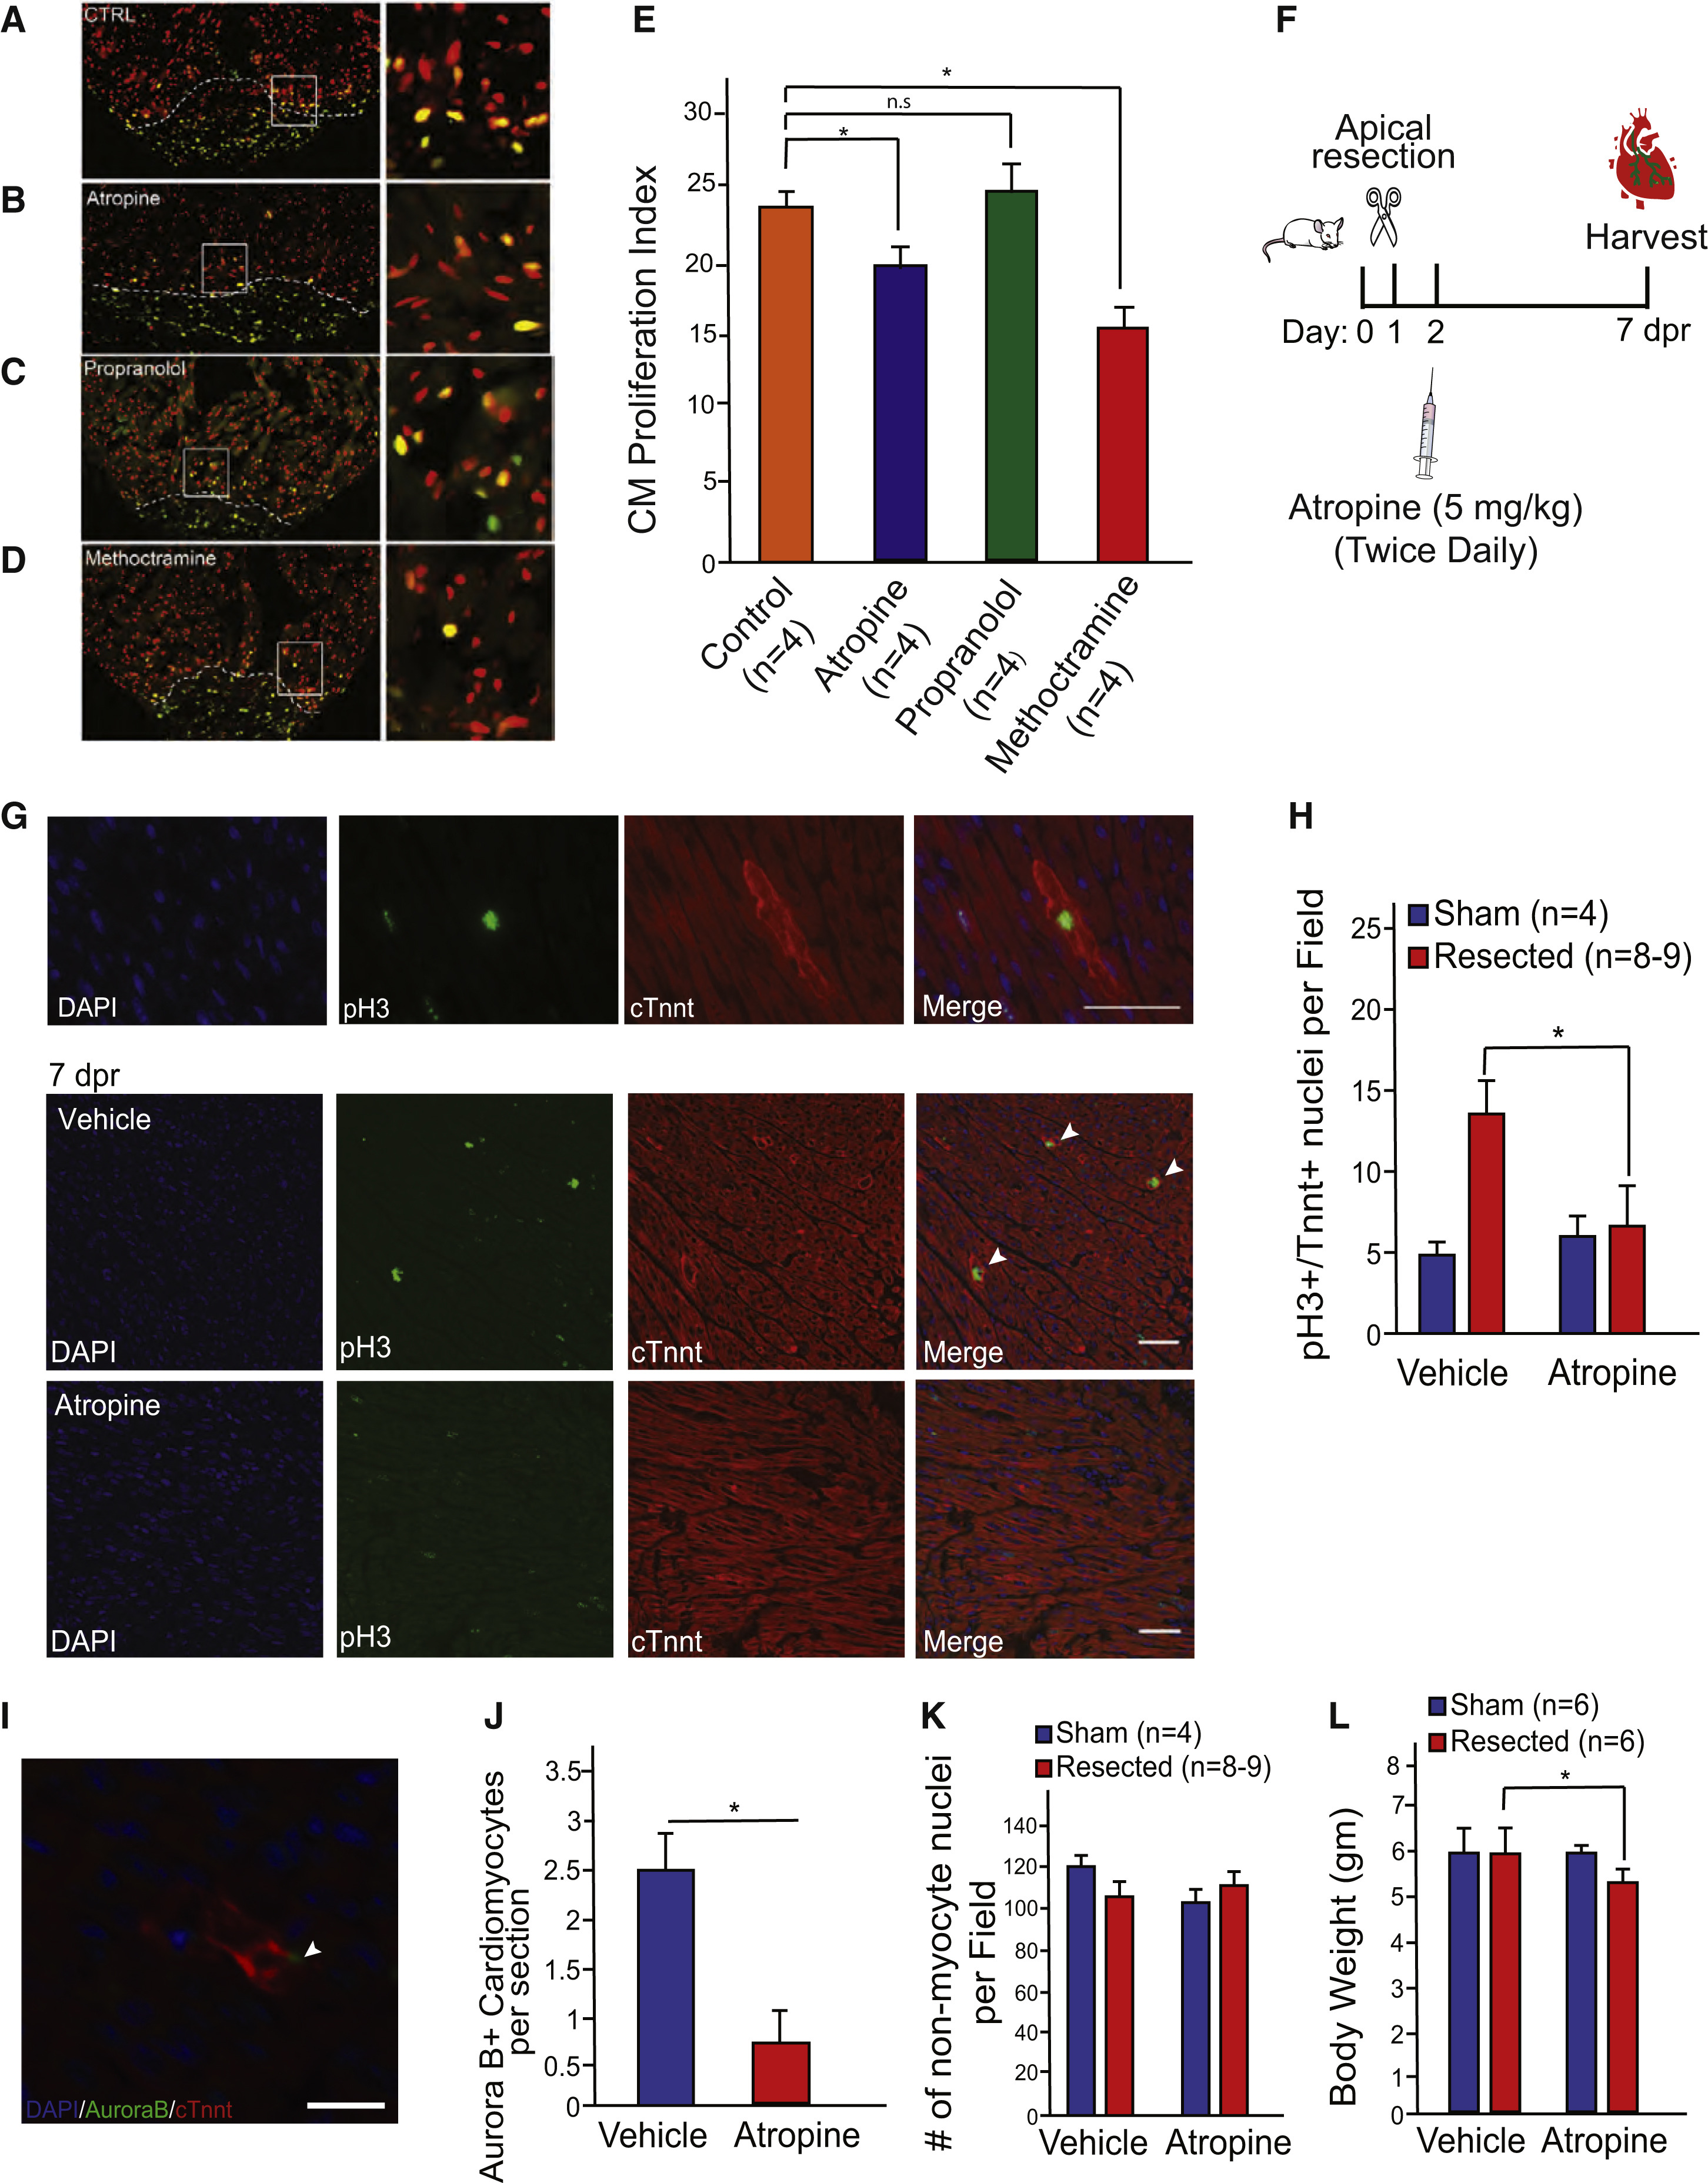
(A) Zebrafish hearts were fixed and immunostained for PCNA and Mef2C at 7 days after surgical amputation. Hearts derived from zebrafish treated with water (Control) displayed notable cardiomyocyte proliferation.
(B) Atropine-treated zebrafish exhibited a reduction in proliferating cardiomyocytes.
(C) PCNA and Mef2c staining at 7 dpa for propranolol-treated zebrafish. Control and propranolol-treated zebrafish showed equivalent cardiomyocyte proliferation.
(D) PCNA and Mef2c staining at 7 dpa for methoctramine-treated zebrafish showed significant reduction in cardiomyocyte proliferation. Boxed regions in (A)–(D) are shown at higher zoom in the left panels.
(E) Quantification of proliferating cardiomyocytes showing a significant reduction of the number of proliferating cardiomyocytes in atropine- and methoctramine-treated zebrafish compared to control water- and propranolol-treated zebrafish.
(F) Schematic of atropine injection strategy in neonatal mice.
(G) Mouse hearts were fixed and immunostained for phospho-histone H3 (pH3) and cardiac troponin T (cTnnt) at 7 dpr in vehicle- and atropine-treated mice. The upper panel shows a high-magnification image of a pH3+ cardiomyocyte. Scale bar represents 50 µm.
(H) Quantification of the number of proliferating cardiomyocytes at 7 days post apical resection showing a significant decrease of proliferating cardiomyocytes in neonatal mice.
(I) Immunostaining of Aurora B and cTnnt. Scale bar represents 50 µm.
(J) Quantification of the Aurora B+ cardiomyocytes showing a significant reduction in the number of Aurora B+ cardiomyocytes in atropine-treated mice.
(K) Quantification of the number of nuclei in heart sections of vehicle- and atropine-treated mice showing no significant differences between treatments.
(L) Body weights of vehicle- and atropine-treated mice following sham and resection showing a significant reduction in body weights of atropine-resected mice but no changes in sham-operated mice. Data presented as mean ± SEM, where p < 0.05 was considered statistically significant.
See also Figure S1.
Reprinted from Developmental Cell, 34(4), Mahmoud, A.I., O'Meara, C.C., Gemberling, M., Zhao, L., Bryant, D.M., Zheng, R., Gannon, J.B., Cai, L., Choi, W.Y., Egnaczyk, G.F., Burns, C.E., Burns, C.G., MacRae, C.A., Poss, K.D., Lee, R.T., Nerves Regulate Cardiomyocyte Proliferation and Heart Regeneration, 387-99, Copyright (2015) with permission from Elsevier. Full text @ Dev. Cell

