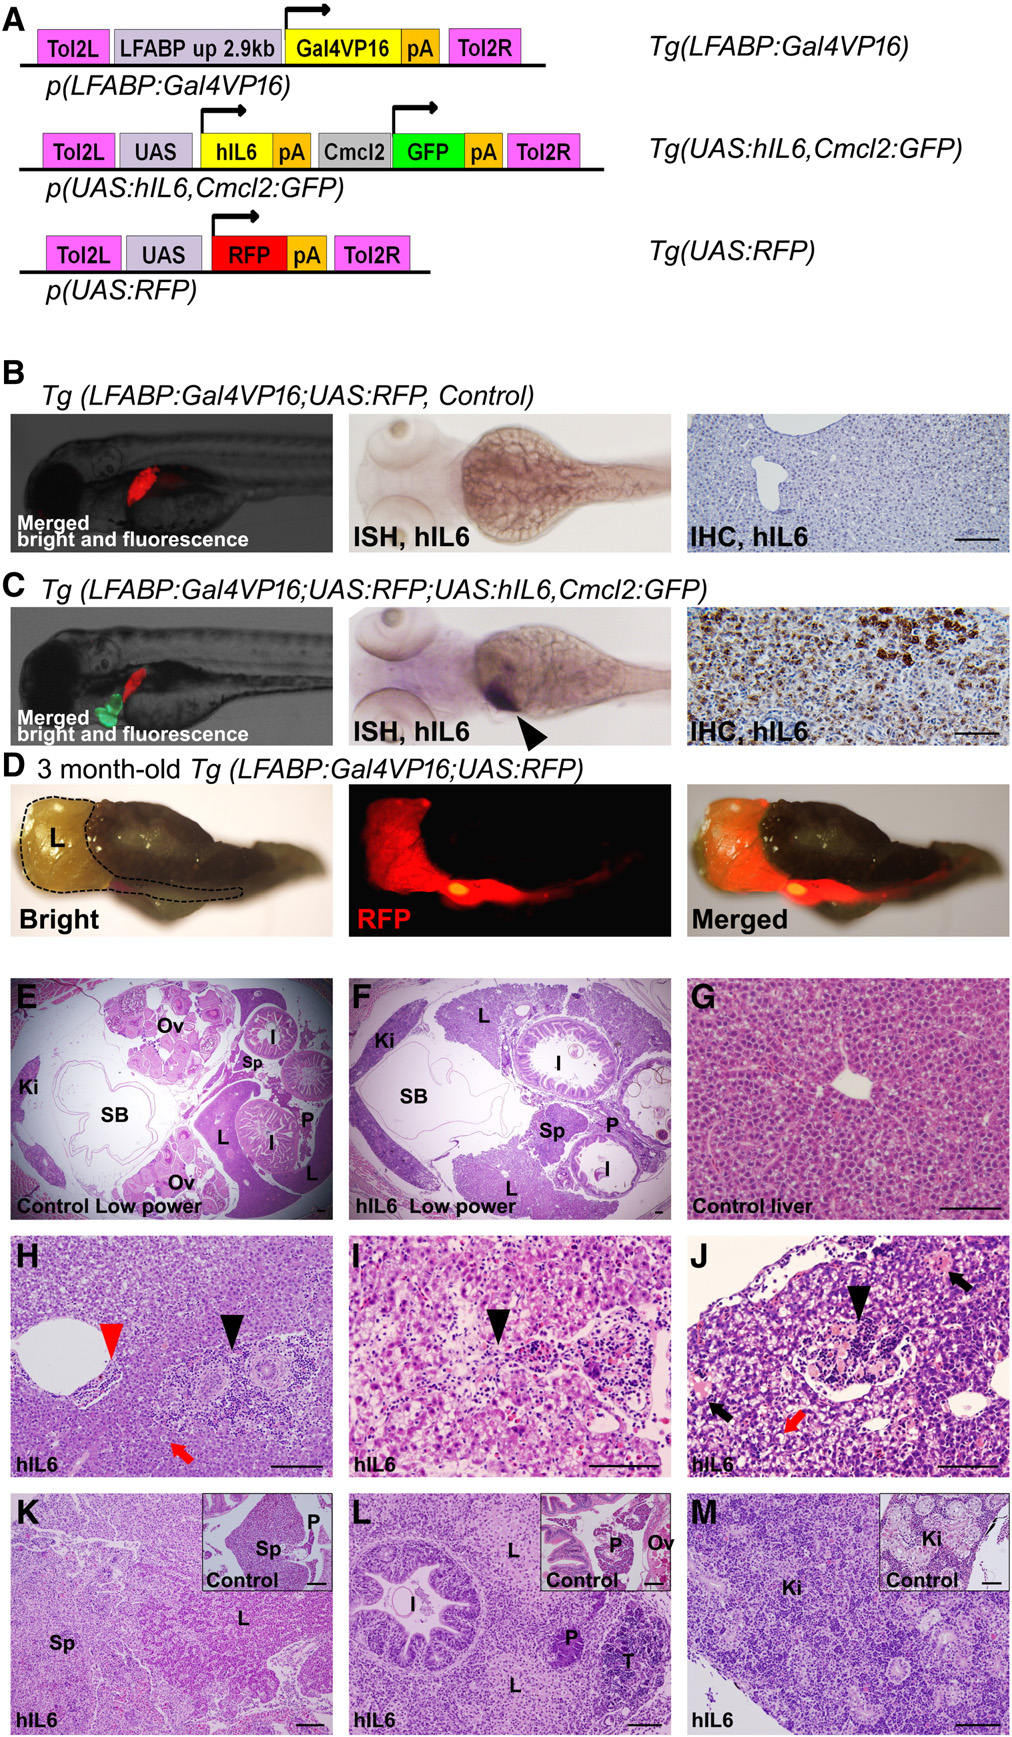
Fig. 1
Transgenic strategy and specific expression of hIL6 gene in transgenic zebrafish. (A) Structure of the constructs used in the Tol2-mediated transgenesis. (B and C) Embryo images at 4 dpf (left, merged images) showed RFP expression in the liver. Hepatic expression of RFP and cardiac expression of GFP were used as the indicators to select the transgenic embryos under a fluorescence microscope. ISH for hIL6 (middle) at 4 dpf showed its RNA expression in the liver (black arrowhead). IHC at 6 weeks (right) showing the hIL6 expression at the hepatocytes only in Tg(LFABP:Gal4VP16;UAS:RFP;UAS:hIL6,Cmcl2:GFP). (D) A whole dissected viscera at 3 months showing the liver-specific expression of RFP. Dotted line indicates liver boundary. (E and F) Low-power images at 2 months. Note that the liver surface of the hIL6-expressing transgenic fish shows irregular contour due to inflammation. (G) H&E image of control liver at 6 weeks of age showing normal architecture with central vein at the center of image. (H–J) H&E images of the hIL6-expressing zebrafish showing the infiltration of inflammatory cells in the liver at 6 weeks of age. (H) Infiltration of the inflammatory cells was noted at a portal and a perivascular area (black and red arrowheads, respectively). Feathery degeneration (red arrow) is seen. (I) Inflammatory cells at hepatic sinusoids (black arrowhead). Pale to clear cytoplasm suggests ballooning degeneration of hepatocytes. (J) Inflammatory cells in an intrahepatic vessel (black arrowhead) are noted. Spotty necrosis (black arrows) and feathery degeneration (red arrow) are noted. (K–M) Three-month-old zebrafish. (K) Severe inflammation caused enlargement of spleen and adhesion to the liver (inset, control spleen). (L) Destructive change causing adhesion of liver, pancreas, intestine, and testis (inset, control pancreas). Swollen hepatocytes with pale cytoplasm indicate ballooning degeneration of the hepatocytes. (M) Inflammatory cell infiltration in the kidney (inset, control kidney showing hematopoietic cells between renal tubules). Ki, kidney; I, intestine; L, liver; Ov, Ovary; P, pancreas; SB, swim bladder; Sp, spleen; T, testis. Bars, 50 µm.

